AMZN Guidance Drags on NASDAQ

THE WEEKEND ISSUE
Informing Investors Around The World
Read In All 50 States And Over 100 Countries
Weekend Newsletter for
February 3, 2019
Table Of Contents 1) MARKET SUMMARY from THE DAILY 2) STOCK SPLIT REPORT 3) IH ALERTS 4) SUCCESS TRADING GROUP 5) COVERED CALL SERVICE

1) MARKET SUMMARY > >From “The Daily” by Jon Johnson at InvestmentHouse.com
Friday produced a ton of data about the economy, but it was all somewhat anticlimactic.
– A mix of data to end the week closes the market mixed but nicely higher for the week.
-AMZN guidance drags on NASDAQ.
-Jobs report stronger than expected, revisions placate worries of too much strength.
-Trade talks end with an agreement for Trump/Xi meeting.
-Well entrenched leaders enjoy a strong week while other areas are trying to form up and join leadership as did the chips.
Market Summary (continued)
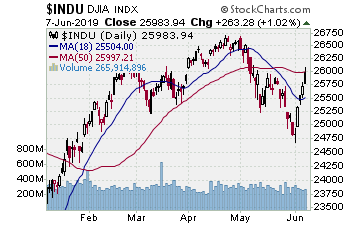
Friday produced a ton of data about the economy, but it was all somewhat anticlimactic. Good jobs data pushed stocks higher from weaker futures, helping offset AMZN’s earnings guidance and the lack of a trade deal after the US/China meeting. On balance the market handled all the news decently, closing mostly higher though NASDAQ was weighed down by AMZN.
The week was so much more than Friday, however. Other earnings from big names kept the upside working. AAPL and BA led the move with their earnings and gap rallies Wednesday. FB led higher Thursday with a big upside gap. Lots of earnings on the week, lots of beats, lots of top line misses attesting to the economic slowing that resulted just as the FOMC’s Powell issued his October proclamation against the economy and by extension the markets. What is new about that? Nothing at all. The Fed always acts too late, it always reacts to the prior cycle, not the current one. I think that is called fighting the last war.
Ah, the Fed. It was a huge contributor to the market as well. Already indicating it had flipped its view from the October announcement it was hiking a set number of times regardless, the FOMC meeting simply confirmed that. But confirmation is very important — putting it in writing means more. Stocks were up Wednesday before the FOMC (AAPL, BA), but the FOMC statement and Powell’s conference comments jumped stocks further upside.
Friday saw jobs, AMZN and other earnings, and ISM January. Jobs beat expectations and was solid though December was written 90K lower (222k vs 312k); that revision actually helped as investors decided that was not too strong to impact the Fed.
Let’s face it: the Fed basically told everyone it was a non-factor for at least a quarter, some say 6 months. It is data dependent, but after recognizing it was wrong in its economic assessment, it is not going to jump back to hikes anytime soon as that would expose it for what it is — clueless, no better at timing economic cycle turns than most investors are at telling when the market is topping or bottoming. Thus, good economic data is likely read by the market as good for the market.
Read “The Daily” Entire Weekend Summary
Watch Market Overview Video
Watch Technical Summary Video
Here’s a trade from “The Daily” and insights into our trading strategy:
Chart by StockCharts.com
It was another week of gains on the stock indices, and more plays were of course paying off. As there is still that huge yearlong 2018 top hanging out there, I don’t care what the bulls ignore, saying that December was the bear market. Sure there was a knifepoint turn off the low and that suggests a complete reversal, but the top is not eliminated yet, and thus you still have to watch out for ‘in your ear’ as Shoeless Joe Jackson coached Moonlight Graham in ‘Field of Dreams.’ Thus, you take some gain along the way in partial profits and see if the rest of the move can continue. So we did that. On some we took it all if they were near term options.
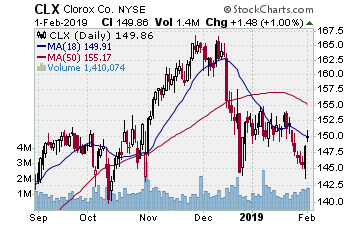
CLX (Clorox Co.)
Company Profile
Downside play we entered on 1/14 with some Feb puts at $4.60. It was no bomb lower, just continued lower into Wednesday and showed a doji. Thursday it gapped lower, started to rebound. That was the signal to take gains and sold the puts for $7.0, banking over 50%.
FB (Facebook, Inc.)
Company Profile
FB is another play we entered 1/14, but this was upside. It broke higher off the 50 day MA, buying some March $145.00 calls for $9 and some stock for $145.62. FB moved higher, but it was back and forth into last week. We held through earnings. FB crushed them, gapped to the 200 day SMA. We banked half the options for $23 (155%), some stock for $166.57 (14+%).
DATA (Tableau Software, Inc.)
Company Profile
Entered 1/15 with some February $120.00 strike calls for $8.80. Broke higher, then immediately sold back to the 50 day MA. After that, a slow steady move higher, jagged but strong. Made it to the December peak Thursday on the high and we sold calls for $14.40, banking over 60% on the options.
AMZN (Amazon.com, Inc.)
Company Profile
We took the rest of the AMZN option position acquired on 12/26. The February $1400.00 call options bought for $113.55 sold for $312, banking 170+%.
UCTT (Ultra Clean Holdings, Inc.)
Company Profile
Moved in on 1/24 with some stock at $9.92 and some March $10.00 strike call options for $0.90. UCTT gapped off the 50 day MA test after breaking over that resistance. The stock has gone straight up. It hit our initial target 1/30 (Wednesday) and we sold some options for $1.80, banking 100%. We sold some stock for $11.35, a 14% gain. UCTT is still moving higher.
VRSN (VeriSign, Inc.)
Company Profile
Entered VRSN on 12/27 with some stock at $146.89 and some February $145.00 strike call options for $9.80. VRSN went mostly straight upside, trending up the 10 day EMA. We banked some VRSN already on 1/9, and Friday we banked another half of the options for $24.40, a 148% gain. Sold half the stock for $170.48, a 15+% gain.
GOOG (Alphabet Inc.)
Company Profile
Entered on 1/15 as it moved up off the 50 day MA, buying some Feb. $1070.00 strike call options for $41.50. GOOG surged nicely, but then gapped lower the following Monday. Worked laterally for a week, then surged Wednesday and Thursday. Friday GOOG rallied over the 200 day SMA but . . . it could not stick. Faded off the highs and we sold half the options for $59, a 42% gain. Earnings after the Monday close and tempted to let at least part run through the results.
Receive a 2 week trial and if you stay on receive a $30 per month discount!
2) STOCK SPLIT REPORT Here’s a leader play and our current analysis.
Chart by StockCharts.com
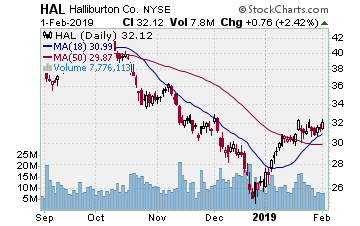
HAL (Halliburton–$32.12; +0.75; optionable): Oil services
Company Profile
EARNINGS: 04/23/2019
STATUS: Inverted head and shoulders. We already have a play on SLB, but it is very lethargic. HAL on the other hand looks a bit better in its 2 week lateral move over the 50 day EMA, showing some good upside breaks on strong volume. Friday was a good upside price move though on that day volume did not follow. Still, it is showing more signs of life, and if HAL can make a good solid break higher we want to play the second leg higher off the December low. The initial target is the early November peak that is also the early September low. A move to the target lands a 100+% gain on the call options.
CHART VIDEO
Volume: 7.774M Avg Volume: 11.906M
BUY POINT: $32.26 Volume=12M Target=$36.28 Stop=$31.69
POSITION: HAL APR 18 2019 32.50 C – (46 delta) &/or Stock
Learn more about our Stock Split Report and how we have made gains of 321% with our powerful stock split plays!
Save $360 per year on the Stock Split Report! Plus 2 week trial!
Chart by StockCharts.com
3) IH ALERTS
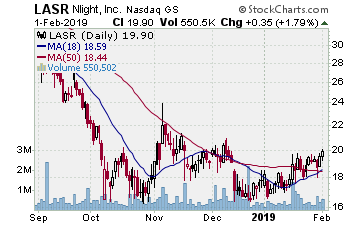
LASR (nLight Inc.–$19.90; +0.34; optionable): Lasers for semiconductors
Company Profile
EARNINGS: 02/20/2019
STATUS: After a decline off a double top spanning June/July 2018, LASR sold off into October. It double bottomed there and broke higher, but only reached the 50 day MA before stalling. That put LASR into another base, something of an inverted head and shoulders the past 3 months. Broke higher over the 50 day MA 2.5 weeks back . . . but did not continue the move. Showed more life late week, with volume coming in Wednesday and again Friday as LASR broke higher. Looks solid, and as it continues this move we want to step in for a recovery up to 24, where the early November spike higher met the September low. That move lands a solid 20% on the stock.
CHART VIDEO
Volume: 550.502K Avg Volume: 541.99K
BUY POINT: $19.96 Volume=650K Target=$24.09 Stop=$18.63
POSITION: LASR MAR 15 2019 20.00C – (55 delta) &/or Stock
Save $600 per year and enjoy a 2 week trial of our IH Alerts Service!
Chart by StockCharts.com
4) SUCCESS TRADING GROUP–by the MarketFN STG Team
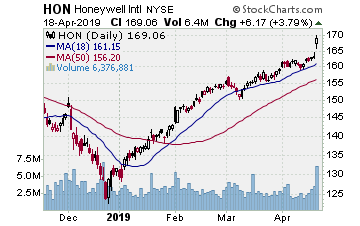
HON (Honeywell International Inc.) Company Profile
Our Success Trading Group members will be looking to enter new positions next week. We have many stocks on our radar including Honeywell International Inc. (Ticker: HON) and Owens-Illinois, Inc. (Ticker: OI).
Our Success Trading Group closed7 years with 0 losses on our Main Trade Table. In fact, we closed 100% winning trades for the calendar years 2016, 2015, 2013, 2012, 2011, 2010 and 2009 (we still have 1 open position from 2017 (all others were winners) and 1 trade that we opened in 2014 was closed as a losing trade). All of these trades are posted on our Main Trade Table for your review during your free membership trial period.
Get Our Next Trade Free – Save $50 per month! Details Here.
Chart by StockCharts.com
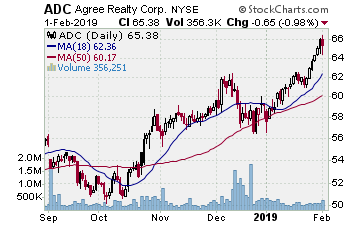
5) COVERED CALL PLAY
ADC – Agree Realty Corp. is currently trading at $65.38. The March $65.00 Calls (ADC20190316C00065000) are trading at $1.65. That provides a return of about 6% if ADC is above $65.00 on expiration Friday in March.
