Berkshire Lets On It Bought Some AMZN

THE WEEKEND ISSUE
Informing Investors Around The World
Read In All 50 States And Over 100 Countries
Weekend Newsletter for
May 5, 2019
Table Of Contents 1) MARKET SUMMARY from THE DAILY 2) STOCK SPLIT REPORT 3) IH ALERTS 4) SUCCESS TRADING GROUP 5) COVERED CALL SERVICE

1) MARKET SUMMARY > >From “The Daily” by Jon Johnson at InvestmentHouse.com
Futures were up pre-Jobs Friday.
– Jobs strong on the headlines, Berkshire lets on it bought some AMZN, and Fed speakers walk back Powell’s comments. Of course stocks jump.
-Stocks break higher but indices still in the same relative position and on light volume again, sans RUTX.
-RUTX finally breaks some resistance, still miles from a high, while SP500, NASDAQ still trying to put in a definitive high.
-Jobs created but still almost 1/3 of the US, over 100M working aged citizens, are not working.
-Plenty of good tech setups along with financials, rails, to name a few.
-After the excitement from Friday dies down, will the buyers remain or will sellers that showed up the past week show up again?
Market Summary (continued)
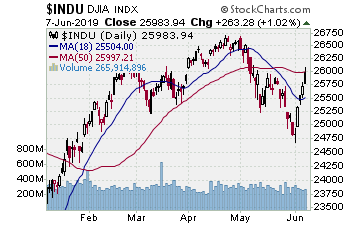
Futures were up pre-Jobs Friday, and when the jobs report headline numbers beat expectations the market hesitated briefly. A big top line beat, unemployment drops 2BP, wages decent at 3.2% year/year. Still, Powell’s comments from Wednesday about ‘transient’ weak prices and no need to move either direction with rates were fresh.
With some other Fed commentary, however, commentary that walked back Powell’s post-FOMC statements, stocks held the bid and indeed improved upon it. They rallied to midmorning, tested a bit, then rallied to mid-afternoon where they pretty much flat-lined to the close. Not a bad day upside after some shaky sessions, but in reality the action simply left the indices in the same old, same old — except for RUTX.
SP500 28.12, 0.96%
NASDAQ 127.23, 1.58%
DJ30 197.16, 0.75%
SP400 1.43%
RUTX 1.98%
SOX 0.65%
NASDAQ 100 1.58%
VOLUME: NYSE -5%, NASDAQ -6%. Again below average volume on a move higher. That would not be such a downer if there was no selling on the week. There was some distribution, however, right at the prior highs as upside was turned back.
ADVANCE/DECLINE: NYSE +3.5:1, NASDAQ +3.9:1. Now THAT is impressive breadth, more of a bullish indicator.
Now I know, gains of 1% and better by the indices are not chicken feed. They just didn’t change the game from where it is being played: in a range near the SP500 and NASDAQ prior highs or other key resistance for the indices.
Thus, while Friday was a solid upside session from start to finish, if it is going to show more it will have to . . . show more next week.
Read “The Daily” Entire Weekend Summary
Watch Market Overview Video
Watch Technical Summary Video
Watch Next Session Video
Here’s a trade from “The Daily” and insights into our trading strategy:
Chart by StockCharts.com
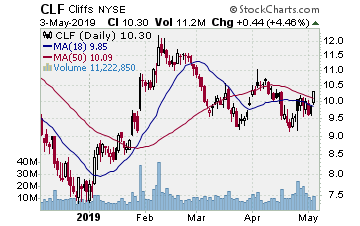
CLF (Cliffs Natural Resources–$10.30; +0.44; optionable): Industrial metals and minerals
Company Profile
EARNINGS: 07/25/2019
STATUS: Double bottom. CLF continues to set up a good pattern, the most recent 3 months a double bottom. This is part of a larger pattern started in September 2018, the last 3 months the handle to a cup. Good volume the past two weeks as CLF came off the second low. Friday a solid upside break with a move through the 50 day and 200 day SMA. Volume rallied to just above average. Nice setup and break higher, and as CLF continues, we want to move in for a run at the early February high. That move gains 18% on the stock and 70%ish on the options.
CHART VIDEO
Volume: 11.183M Avg Volume: 10.824M
BUY POINT: $10.32 Volume=12M Target=$12.19 Stop=$9.69
POSITION: CLF JUL 19 2019 10.00C – (60 delta) &/or Stock
Receive a 2 week trial and if you stay on receive a $30 per month discount!
2) STOCK SPLIT REPORT Here’s a leader play and our current analysis.
Chart by StockCharts.com
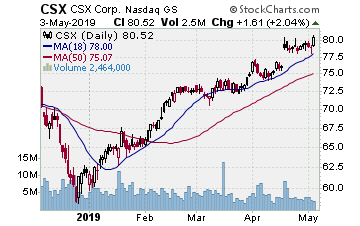
CSX (CSX Corp.–$80.52; +1.61; optionable): Railroads
Company Profile
EARNINGS: 07/16/2019
STATUS: After basing from mid-August to April, CSX broke out three weeks back, gapping out of the base. Now that does not mean CSX went nowhere. Indeed, it has put in an impressive run off the December low. It was good to see, however, the gap on volume as it made the break from that long base. For over 2 weeks after that gap CSX worked laterally over the 10 day EMA. Finally the next break higher Friday, and with that kind of move we want to play CSX as it continues on the line. A rally to the initial target gains 60+%ish on the call options.
CHART VIDEO
Volume: 2.446M Avg Volume: 4.168M
BUY POINT: $80.57 Volume=5.5M Target=$84.94 Stop=$79.11
POSITION: CSX AUG 16 2019 80.00C – (57 delta)
Learn more about our Stock Split Report and how we have made gains of 321% with our powerful stock split plays!
Save $360 per year on the Stock Split Report! Plus 2 week trial!
Chart by StockCharts.com
3) IH ALERTS
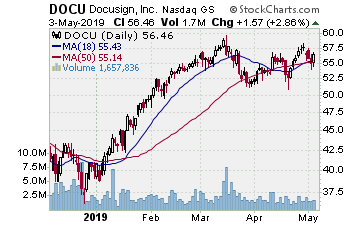
DOCU (DocuSign–$56.46; +1.57; optionable)
Company Profile
EARNINGS: 06/13/2019
STATUS: Cup w/handle. Looking at DOCU again as it has worked to form an 8 week handle to a cup with handle base that started in August 2018 with that peak. The handle is basically a triangle formed using the 50 day MA as support. Put in a higher low at the 50 day MA late week and started upside Friday on rising volume. Okay, looking for a breakout move from the handle as our entry signal. Want to see some good volume on that move to propel the stock toward that August peak as the initial target. That move gains 18%ish on the stock and over 100% on the call options.
CHART VIDEO
Volume: 1.655M Avg Volume: 2.229M
BUY POINT: $57.38 Volume=2.8M Target=$67.88 Stop=$53.88
POSITION: DOCU JUN 21 2019 57.50C – (48 delta) &/or Stock
Save $600 per year and enjoy a 2 week trial of our IH Alerts Service!
Chart by StockCharts.com

4) SUCCESS TRADING GROUP–by the MarketFN STG Team
MS (Morgan Stanley) Company Profile
Our Success Trading Group members scored another winning trade this week when we closed out a position in Morgan Stanley (Ticker: MS). We are watching several stocks and are looking forward to trading next week.
Our Success Trading Group closed7 years with 0 losses on our Main Trade Table. In fact, we closed 100% winning trades for the calendar years 2016, 2015, 2013, 2012, 2011, 2010 and 2009. All of these trades are posted on our Main Trade Table for your review during your free membership trial period.
Get Our Next Trade Free – Save $50 per month! Details Here.
Chart by StockCharts.com
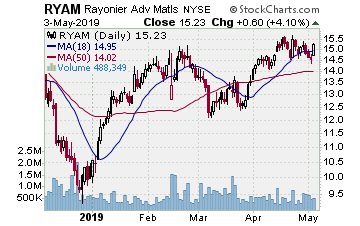
5) COVERED CALL PLAY
RYAM – Rayonier Advanced Materials Inc. is currently trading at $15.23. The June $15.00 Calls (RYAM20190622C00015000) are trading at $1.05. That provides a return of about 6% if RYAM is above $15.00 on expiration Friday in June.
