Canada/US Go at it Again Starting Wednesday

THE WEEKEND ISSUE
Informing Investors Around The World
Read In All 50 States And Over 100 Countries
Weekend Newsletter for
September 2, 2018
Table Of Contents 1) MARKET SUMMARY from THE DAILY 2) STOCK SPLIT REPORT 3) IH ALERTS 4) SUCCESS TRADING GROUP 5) COVERED CALL SERVICE

1) MARKET SUMMARY > >From “The Daily” by Jon Johnson at InvestmentHouse.com
The week saw new highs or higher highs through Wednesday on all the indices.
– Stocks rally to new highs midweek, test modestly into Friday.
– Canada/US fail to reach trade agreement but will go at it again starting Wednesday.
– NASDAQ near the upper channel line, SOX as well.
– NASDAQ leaders may test soon, but others in NASDAQ and in more industrial areas are close if not already there on tests.
Market Summary (continued)
The week saw new highs or higher highs through Wednesday on all the indices followed by a modest test to end the week and the month. That leaves the indices set up quite well for a new upside move to start the new month.
Oh yes, the new month. September. The month most associated with losses. Well, in 2017 SP500 rallied 48 points (1.9%), NASDAQ 1%. Didn’t tear the cover off the ball thanks to a late month dip, but hardly living up to September’s unsavory reputation.
Of course, whenever the market rallies for as long as this one has and is punching out new highs, the worry is about market tops. Not without reason. The economy is strong with 4.2% Q2 GDP and the Atlanta Fed calling for 4.6% this quarter. Yet, the recent data has softened. I believe it is just a soft spot in the expansion, but of course the doom websites and authors are saying we are at a 2000 and 2007 type of top.
Some headlines today from those sites:
‘The decoupling has never been greater’
‘Once the bubbles pop, we’re all broke’
Typical daily headlines. What most people do not know and what is bandied about by the global elite — and even discussed by some great true economists such as Milton Friedman — is the ultimate fix, the ultimate reset button, if it becomes necessary.
Read “The Daily” Entire Weekend Summary
Watch Market Overview Video
Watch Technical Summary Video
Watch Next Session Video
Here’s a trade from “The Daily” and insights into our trading strategy:
Chart by StockCharts.com
A break to new highs or higher highs on all indices pushed our positions to initial targets or beyond. That allowed us to take some nice gains.
AMZN (Amazon.com, Inc.)
Company Profile
Picked up this position 8/23 with some NOV $1905.00 calls for $112.40 as AMZN bounced off a near support test. Sold some 8/30 at $164.00, banking 45+%.
GRUB (GrubHub Inc.)
Company Profile
Picked up this position 8/2 for $127.77 along with some December $130.00 strike calls for $12.65. Hit the initial target 8/27 and sold some for $138.15 (8+%) and $18.40 (45%).
MYGN (Myriad Genetics, Inc.)
Company Profile
Bought this 7/19 for $43.72 and some NOV $44.00 calls for $4.80. The stock finally moved again just over a week back. Nice move, but then it stalled out and just drifted. Got tired of waiting, sold the stock for $49.45 (13%) and the options for $7.1 (48%).
NEPT (Neptune Technologies & Bioressources Inc.)
Company Profile
A stock play we picked up 8/21 at $3.31 and banked some gain 8/29 at $4.1, 23+%.
OMER (Omeros Corporation)
Company Profile
Picked up this position on 7/26 but it was a volatile ride at times. OMER recovered nicely, however, and on 8/30 we sold some stock for $24.88 (12.5%) and the SEP $21.00 call options for $4.1 (28%). Happy to get a gain after the volatility.
ROKU (Roku, Inc.)
Company Profile
Picked up this position 8/16 as it broke higher off a test, buying stock at $57.91 and some October $55.00 options at $6.42. Sold 8/27 for $62.4 (7.75%) and $10.00 (55+%).
SQ (Square, Inc.)
Company Profile
12.8% stock, 77% options, letting the rest run.
TJX (The TJX Companies, Inc.)
Company Profile
Bought into TJX 7/19 for $97.26 and some October $95.00 strike calls for $5.40. Took some time but sold some 8/30. Sold some stock for $108.32, an 11% gain. Sold some of the calls for $13.80 a 155% gain.
V (Visa Inc.)
Company Profile
Picked up this position 7/17; it took awhile. Bought SEP $140.00 calls for $4.60. Finally able to sell some 8/30 for $7.15, a 55% gain.
VRSN (VeriSign, Inc.)
Company Profile
Originally bought on 7/2 and took some gain before. Stocks at $129.98 and SEP $140.00 calls for $7.80. On 8/30 we cashed in more of the options for $17.80 (128%) and some more stock for $157.20, a 12.3% gain.
Receive a 2 week trial and if you stay on receive a $30 per month discount!
2) STOCK SPLIT REPORT Playing stock splits can be very profitable, but it takes know-how. Our stock split service focuses on three main types of plays: 1) pre-announcement (where we forecast an upcoming split prior to the company making the announcement); 2) pre-split (these plays are made in the days leading up to the actual split day); and 3) post-split plays (plays made after the actual stock split where the stock is showing continued or renewed strength).
Listen to Stock Split Report Editor Jon Johnson’sstock split interview on CNBC-TV [ View Here ]
Here’s a post-split play and our current analysis.
Chart by StockCharts.com
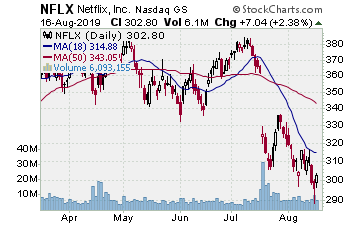
NFLX (Netflix–$367.68; -3.30; optionable)
Company Profile
EARNINGS: 10/15/2018
STATUS: Double bottom w/handle. Sure NFLX split in 2015 at a price over $700; indeed, it may want to announce a split at a lower price (the prior split was 7:1). We are willing to play NFLX as it recovers here, split coming or prior or no. NFLX put in a double top spanning June into July, then gapped lower on its earnings miss. The stock has been in purgatory since, putting in a lower low 2 weeks back, undercutting the late July low. MACD put in a bit higher low suggesting momentum turning upside. NFLX broke upside and rallied to the 50 day SMA as of Monday, moving on good volume. Spent the entire week working laterally at the 50 day SMA on light trade. Okay, we will wait and see if NFLX can give us a breakout upside from this 8 week base. Want to see it make the break and make it stick and we move in.
CHART VIDEO
Volume: 7.943M Avg Volume: 12.376M
BUY POINT: $371.45 Volume=17M Target=$419.85 Stop=$355.45
POSITION: NFLX NOV 16 2018 370.00 C – (53 delta) &/or Stock
Learn more about our Stock Split Report and how we have made gains of 321% with our powerful stock split plays!
Save $360 per year on the Stock Split Report! Plus 2 week trial!
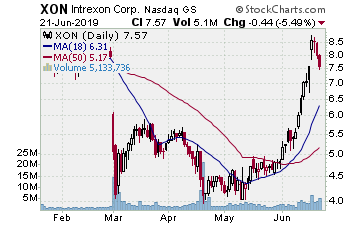
Chart by StockCharts.com
3) IH ALERTS
XON (Intrexon–$15.38; +0.16; optionable): Biotech
Company Profile
EARNINGS: 11/08/2018
STATUS: XON is in a continuing downtrend but it has a repetitive pattern. It will form a rounded bottom, rally nicely off it, then stall out and form a new rounded bottom. XON formed a low in late 2017 then broke higher March 2018 through mid-April. That was the peak and now XON has faded and formed the same kind of pattern along the 200 day SMA. XON moved up through the 200 day SMA just over a week back, peaked with a doji Wednesday, and tested back into Friday, holding over the 200 day. Okay, this is the setup where XON rallies nicely. This time it might even breakout because it has moved over the 200 day SMA. If so, great. For now we want to play that surge upside if it comes and take what it gives us. If more, great. First, however, needs to make an upside break on some volume to give us the entry for a run to fill a gap lower from early May.
CHART VIDEO
Volume: 533.407K Avg Volume: 1.036M
BUY POINT: $15.77 Volume=1.2M Target=$18.85 Stop=$14.72
POSITION: XON NOV 16 2018 15.00 C – (63 delta, low OI) &/or Stock
Save $600 per year and enjoy a 2 week trial of our IH Alerts Service!
Chart by StockCharts.com
4) SUCCESS TRADING GROUP–by the MarketFN STG Team
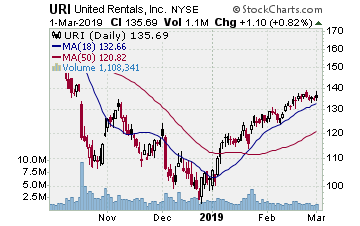
URI (United Rentals, Inc.) Company Profile
Our Success Trading Group members scored another winning trade this week when we closed out a position in United Rentals, Inc. (Ticker: URI). We currently like Walmart, Inc. (Ticker: WMT) at its current price for new positions.
Our Success Trading Group closed7 years with 0 losses on our Main Trade Table. In fact, we closed 100% winning trades for the calendar years 2016, 2015, 2013, 2012, 2011, 2010 and 2009 (we still have 1 open position from 2017 (all others were winners) and 1 trade that we opened in 2014 was closed as a losing trade). All of these trades are posted on our Main Trade Table for your review during your free membership trial period.
Get Our Next Trade Free – Save $50 per month! Details Here.
Chart by StockCharts.com
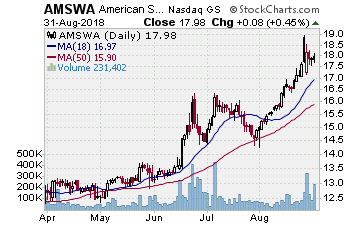
5) COVERED CALL PLAY
AMSWA – American Software, Inc. is currently trading at $17.98. The October $17.50 Calls (AMSWA20181020C00017500) are trading at $0.90. That provides a return of about 6% if AMSWA is above $17.50 on expiration Friday in October.
