Drama, Drama, Drama

THE WEEKEND ISSUE
Informing Investors Around The World
Read In All 50 States And Over 100 Countries
Weekend Newsletter for
January 27, 2019
Table Of Contents 1) MARKET SUMMARY from THE DAILY 2) STOCK SPLIT REPORT 3) IH ALERTS 4) SUCCESS TRADING GROUP 5) COVERED CALL SERVICE

1) MARKET SUMMARY > >From “The Daily” by Jon Johnson at InvestmentHouse.com
Fridays, walls, balls, shutdowns that really are not, re-openings, and of course, markets.
– Trade on again, shutdown is shutdown, NYSE indices break higher from the test.
-SOX continues higher, taking the lead in the third leg.
-Stocks rise in the face of less than great news, lead by an important, often market-leading group.
-A new bounce for the third leg on Friday, but of course in a recovery there is little margin for error.
Market Summary (continued)
Drama, drama, drama. Futures were higher Friday as some of the drama remained, some lifted. Trade news was upbeat as the meeting between Chinese and US trade people that never existed but was cancelled Tuesday was said to be back on. A preliminary protocol-type meeting for the end of January meeting — but are we not at the end of January now? Ah, such is the state of what is considered news today.
The shutdown over the border wall — among other things — still continued as of Friday morning. Who would blink first? The reporting of carnage continued, though the metrics show that even with a government shutdown, government spending was down by just 7% per day. Even with the shutdown still ongoing, stocks were ready to try a rally.
Late day, word came that a deal was struck, a 3-week reopening of the government, no money for a border wall. It is hoped the respite will allow the sides to agree. Hmmm. Both sides are entrenched, at least the ones calling the shots. Several GOP senators pleaded to reopen the government — had to get their spending fixes I suppose — and that put pressure on the GOP. Many democrats were doing the same. Their voices were loud enough for a truce, but of course both sides have spent the ensuing 24 hours claiming victory. A 3-week window of funding is victory for anyone? Questionable.
GOP pundits claim the President broke a promise. No wall, no b*lls appeared to be the response from the GOP-ish side. Democratic leaders claim the President blinked. The White House shot back, stating if no deal is reached with border funding, then get ready for some kind of executive action on the wall.
Hardly reported early Friday was the White House drafting a ‘national emergency proclamation’ including $7B for wall construction. It would appear that if there is no deal with wall funding, something reiterated by top democrats this weekend, there will be some form of executive action. Oh THAT will be well-received.
Read “The Daily” Entire Weekend Summary
Watch Market Overview Video
Watch Technical Summary Video
Watch Next Session Video
Here’s a trade from “The Daily” and insights into our trading strategy:
Chart by StockCharts.com
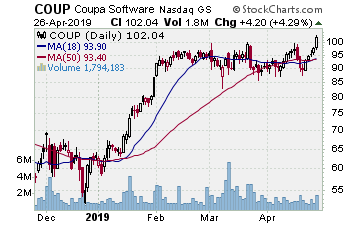
COUP (Coupa Software Incorporated)
Company Profile
One of the strongest sectors in the market is software and we love playing the likes of DATA, CRM, SPLK, WDAY, FIVN. And COUP. After a peak in September, COUP fell into a jagged cup with handle base through early January. We saw it forming a nice handle, coming back to test the 50 day EMA. We put it on the report 1/9. It finished the handle then broke higher 1/15. Strong move and we bought some stock at $68.39 and some March $65.00 strike calls at $8.25. COUP barely slowed the following the break higher. It did rest Tuesday and Wednesday this week but then rallied again Thursday and Friday. Touched the initial target Friday, right at the September highs. That was the point we took half the gain. Sold half the stock at $79.22, banking 15+%. Sold half the options for $16, banking over 90%. Solid and will let the rest of the position continue to work.
Receive a 2 week trial and if you stay on receive a $30 per month discount!
2) STOCK SPLIT REPORT Here’s a leader play and our current analysis.
Chart by StockCharts.com
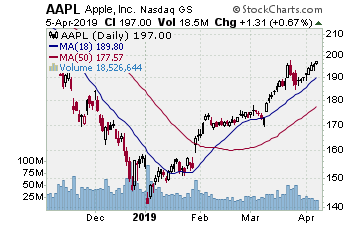
AAPL (Apple, Inc.–$157.76; +5.06; optionable)
Company Profile
EARNINGS: 01/29/2019
STATUS: Earnings are Tuesday after the close so it is tight to earnings, but that is not what we are really working on regarding this play. Perhaps AAPL’s earnings will be poor given all the talk of slowing iPhone sales and production cuts. That makes this an aggressive play, BUT the risk/reward is not bad. AAPL peaked in early October 2018 and fell to a lower low in early January as AAPL gapped lower. MACD put in a higher low and over the past three weeks, AAPL has tried to turn the corner. Since the peak AAPL has 4 serious gap events lower, the last being that early January gap that immediately recovered the next session. If you see 3 gaps lower you start watching for a turn. Four gaps and you get ready. Friday AAPL cleared the prior week’s recovery high on rising trade. We are interested in playing a continued move higher through earnings. A move to the target lands a 65%ish gain on the options though the stock can move past there if the play is right.
CHART VIDEO
Volume: 33.548M Avg Volume: 44.003M
BUY POINT: $158.19 Volume=50M Target=$170.64 Stop=$154.19
POSITION: AAPL APR 18 2019 160.00 C – (49 delta)
Learn more about our Stock Split Report and how we have made gains of 321% with our powerful stock split plays!
Save $360 per year on the Stock Split Report! Plus 2 week trial!
Chart by StockCharts.com
3) IH ALERTS
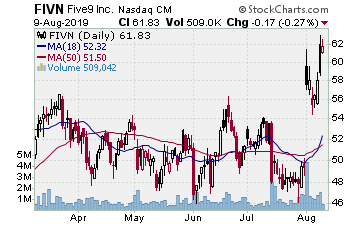
FIVN (Five9–$48.45; +2.14; optionable): Cloud software in many areas
Company Profile
EARNINGS: 02/20/2019
STATUS: FIVN broke out from an August to early January triangle and made us some money on the break higher. It has since formed a 3 week consolidation just below the late August highs that started the triangle. Friday, a strong break higher on rising, above average volume has FIVN at a new closing high. Nice action, ready to enter as FIVN continues upside. A move to the initial target lands 15% on the stock, 80%ish on the options.
CHART VIDEO
Volume: 750.445K Avg Volume: 673.142K
BUY POINT: $48.86 Volume=875K Target=$56.19 Stop=$46.43
POSITION: FIVN APR 18 2019 50.00 C – (47 delta) &/or Stock
Save $600 per year and enjoy a 2 week trial of our IH Alerts Service!
Chart by StockCharts.com
4) SUCCESS TRADING GROUP–by the MarketFN STG Team
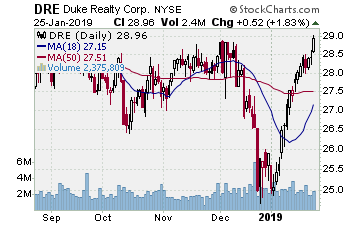
DRE (Duke Realty Corporation) Company Profile
Our Success Trading Group will be watching closely for entry points next week on some of our favorite stocks such as Duke Realty Corporation (Ticker: DRE) and American Express Company (Ticker: AXP).
Our Success Trading Group closed7 years with 0 losses on our Main Trade Table. In fact, we closed 100% winning trades for the calendar years 2016, 2015, 2013, 2012, 2011, 2010 and 2009 (we still have 1 open position from 2017 (all others were winners) and 1 trade that we opened in 2014 was closed as a losing trade). All of these trades are posted on our Main Trade Table for your review during your free membership trial period.
Get Our Next Trade Free – Save $50 per month! Details Here.
Chart by StockCharts.com
5) COVERED CALL PLAY
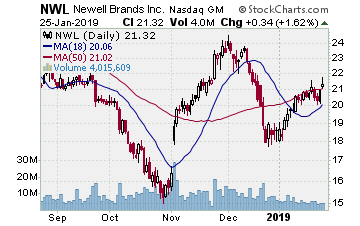
NWL – Newell Brands Inc. is currently trading at $21.32. The March $21.00 Calls (NWL20190316C00021000) are trading at $1.40. That provides a return of about 6% if NWL is above $21.00 on expiration Friday in March.
