Economic Data Slips After Showing Improvement

THE WEEKEND ISSUE
Informing Investors Around The World
Read In All 50 States And Over 100 Countries
Weekend Newsletter for
March 17, 2019
Table Of Contents 1) MARKET SUMMARY from THE DAILY 2) STOCK SPLIT REPORT 3) IH ALERTS 4) SUCCESS TRADING GROUP 5) COVERED CALL SERVICE

1) MARKET SUMMARY > >From “The Daily” by Jon Johnson at InvestmentHouse.com
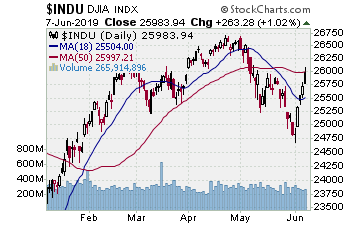
Much was made by Bob Pisani of SP500 cracking over the top of the October/December range.
– More advances on expiration push SP500, NASDAQ over the top of the range — barely.
-SOX posts a strong week, DJ30 lags but would be over resistance but for BA.
-Small and midcaps lag due to rotation to the big names.
-Economic data slips after showing improvement. Soft patch starting to firm overall, however.
-No Fed, no headache. Market preparing to do the improbable and try for new highs.
-After a very good week, before any more breakouts there is likely some kind of profit taking test.
Market Summary (continued)
Much was made by Bob Pisani of SP500 cracking over the top of the October/December range, though he did not call it that, just citing resistance at 2815ish. He failed to note NASDAQ did the same Friday. He said that break of resistance pretty much assures the indices keep rising. I am paraphrasing of course, but I have listened to Mr. Pisani for over a decade so this is nothing new. When you are around as long as he has been at the NYSE it means something — usually that you are a useful patsy for those pushing their book. And as you know, EVERYONE on financial stations pushes their book. Yours truly is the exception, of course. Take what the market gives, right?
But I digress.
It was a good session and a solid upside week rising off a support test.
SP500 14.00, 0.50%
NASDAQ 57.62, 0.76%
DJ30 138.93, 0.54%
SP400 0.18%
RUTX 0.25%
SOX 2.90%
NASDAQ 100 0.88%
VOLUME: NYSE +199%, NASDAQ +58%. Ah, quad witching expiration. Throw the volume figures into the garbage for the day, but note that volume on the week was not bad.
ADVANCE/DECLINE: NYSE 1.4:1, NASDAQ 1.5:1. Very large cap oriented.
Breaking through resistance is always a good indication. In this market of algo-driven trades, however, breakouts and breakdowns through resistance and support have a way of nastily reversing as milestones are used as triggers for profit taking in the form of either selling or buying.
Read “The Daily” Entire Weekend Summary
Watch Market Overview Video
Watch Next Session Video
Here’s a trade from “The Daily” and insights into our trading strategy:
Chart by StockCharts.com
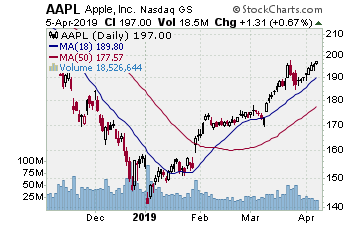
AAPL (Apple, Inc.)
Company Profile
This play took some time, but with AAPL working laterally when we entered in mid-February, we let it. AAPL broke higher from a very flat lateral move over the 50 day MA, and we moved in with some April $170 strike calls for $8.30. It then proceeded to go nowhere. Ended February, faded the first week of March to the 50 day EMA. Finally broke higher, gapping upside Monday and then climbing into Friday, hitting the target. We banked half the gain at $15.10, gaining 80%ish. Nice move and we see if AAPL can squeeze some more out up to the 200 day MA.
GOOG (Alphabet Inc.)
Company Profile
We have two positions on GOOG picked up 3/1 and 3/11. The 3/1 position looked great as GOOG broke higher late February, and we bought some May $1140 strike calls for $49.20. Unfortunately, it stalled after 3 sessions, coming all the way back to the 200 day MA. Okay, when GOOG bounced 3/11, we picked up more positions, some May $1175.00 calls for $47.00 while we let the 3/1 position work. Good week and the 3/1 position hit the initial target midweek. We sold half the options for $86.00, banking around 75%. We thought GOOG might fall back steeper to end the week and into this coming week, so we also sold some of the 3/11 position for $60, banking 27%. If GOOG does test and holds the 10 day, 20 day EMA or somewhere around there, when it bounces we want to pick up more positions.
V (Visa Inc.)
Company Profile
Another stock with multiple positions. Initially bought in on this move 2/5 as V cleared resistance, picking up some April $140.00 calls for $6.50. It quickly tested near support then broke higher again. Nice move to late February, hit the initial target. We sold half the options for $10.3, banking 58%.
V tested the first week of March, hitting the 20 day MA two Fridays back. When it rebounded we picked up some new positions Monday, some May $150.00 calls for $5.00. V rallied through Friday. We sold a bit early, banking more of the gain on the initial position (sold for $13.50, a 107% gain). Sold some of the second position for $7.20, banking 44%. V kept moving into Friday, and we will let the rest move higher, and when it stalls on this move, bank some more of the second position and likely the first given the latter is April options. Then, on a test of near support that holds and bounces again, we re-up for the next run as V is still fresh in its breakout.
Receive a 2 week trial and if you stay on receive a $30 per month discount!
2) STOCK SPLIT REPORT Here’s a leader play and our current analysis.
Chart by StockCharts.com
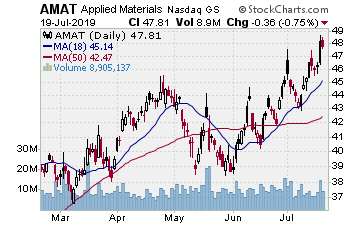
AMAT (Applied Materials–$40.39; +1.46; optionable)
Company Profile
EARNINGS: 05/16/2019
STATUS: Friday AMAT broke higher through the 200 day SMA, starting the move out of a double bottom with handle base the formed off the October and December lows. Last key break was the gap over the down trendline in the second half of January. The 7 week handle followed, and Friday, the aforementioned break upside. Chips got a bit rocky two weeks back, ironed out the issues, and are starting to break higher once more. Good move Friday, and if AMAT can keep it going into next week we want to move in. A rally to the initial target — there is a gap lower from August 2018 — gains 16% on the stock, over 100% on the options. It has been a long time since AMAT looked ‘right,’ and this trend break and solid pattern — not to mention the gap fill to shoot for — looks to have the pieces in place for a good upside move.
CHART VIDEO
Volume: 22.184M Avg Volume: 11.865M
BUY POINT: $40.49 Volume=13M Target=$47.11 Stop=$38.28
POSITION: AMAT JUL 19 2019 40.00 C – (57 delta) &/or Stock
Learn more about our Stock Split Report and how we have made gains of 321% with our powerful stock split plays!
Save $360 per year on the Stock Split Report! Plus 2 week trial!
Chart by StockCharts.com
3) IH ALERTS
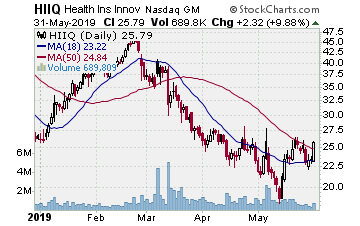
HIIQ (Health Insurance Innovations–$34.17; +0.64; optionable): Health care plans
Company Profile
EARNINGS: 06/05/2019
STATUS: Bear flag. HIIQ recovered with the market from the December low to late February. It tested as you would expect, coming back to the 50 day SMA in early March. Bounced but stalled below the 200 day SMA. Hmmm. That set up a head and shoulders. HIIQ worked laterally measuring the 200 day SMA, but Wednesday it broke sharply lower, falling through the 50 day SMA. Thursday and Friday it rebounded to test that move, showing a doji Friday as it closed well off the intraday high. That suggests a further drop, so if HIIQ falls through the entry point after this recovery we want to play more downside. That move lands 50%ish on the put options.
CHART VIDEO
Volume: 2.08M Avg Volume: 983.841K
BUY POINT: $32.83 Volume=1.4M Target=$26.78 Stop=$34.83
POSITION: HIIQ MAY 17 2019 33.00P – (-40 delta)
Save $600 per year and enjoy a 2 week trial of our IH Alerts Service!
Chart by StockCharts.com
4) SUCCESS TRADING GROUP–by the MarketFN STG Team
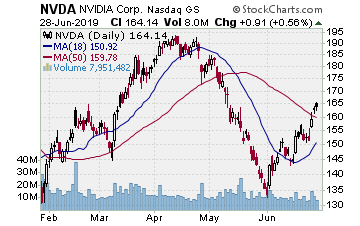
NVDA (NVIDIA Corp.) Company Profile
Our Success Trading Group members closed a winning trade on NVIDIA Corp. (Ticker: NVDA) this week when we traded in and out of NVDA in just two days. We have several stocks on our radar and are looking forward to trading next week.
Our Success Trading Group closed7 years with 0 losses on our Main Trade Table. In fact, we closed 100% winning trades for the calendar years 2016, 2015, 2013, 2012, 2011, 2010 and 2009 (we still have 1 open position from 2017 (all others were winners) and 1 trade that we opened in 2014 was closed as a losing trade). All of these trades are posted on our Main Trade Table for your review during your free membership trial period.
Get Our Next Trade Free – Save $50 per month! Details Here.
Chart by StockCharts.com
5) COVERED CALL PLAY
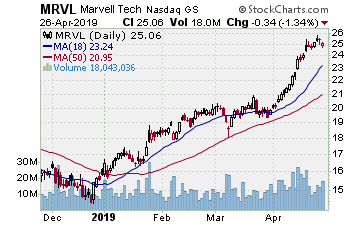
MRVL – Marvell Technology Group Ltd. is currently trading at $20.14. The May $20.00 Calls (MRVL20190518C00020000) are trading at $1.19. That provides a return of about 6% if MRVL is above $20.00 on expiration Friday in May.
