Get Comfortable With the Downside

THE WEEKEND ISSUE
Informing Investors Around The World
Read In All 50 States And Over 100 Countries
Weekend Newsletter for
May 19, 2019
Table Of Contents 1) MARKET SUMMARY from THE DAILY 2) STOCK SPLIT REPORT 3) IH ALERTS 4) SUCCESS TRADING GROUP 5) COVERED CALL SERVICE

1) MARKET SUMMARY > >From “The Daily” by Jon Johnson at InvestmentHouse.com
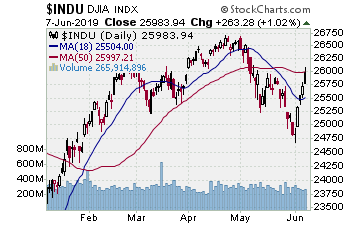
Friday the stock indices tried to make it four straight sessions upside.
– Indices try a fourth session upside, get there, but cannot hold it.
-Overall index patterns just do not look upside positive.
-Leadership remains but it is narrower and of course the chips are down.
-SOX is at the top of its pre-breakout gains where it has to make a stand.
-If need be, get comfortable with the downside.
Market Summary (continued)
Friday the stock indices tried to make it four straight sessions upside, starting weaker but then powering higher into midmorning. This action occurred more than once on the week, and low to high action is typically good action.
Of course, it IS necessary to hold the moves. Thursday the indices rallied nicely, but they also gave up a good amount of the gains into the closing bell. Friday they took it a step – or two or three – farther. Decent enough low to high gains as the Administration postponed auto tariffs for six months, but they could not hold up in the withering fire of late session when trade news hit again, this time not so friendly. Reports from CNBC and others indicated that no talks were ongoing between the US and China, at least regarding trade. Not all that surprising given China’s ‘outrage’ at the US blacklisting Huawei and several related entities as security risks. There are so many episodes of companies finding security backdoors in products sold by Huawei that it is no secret. China just doesn’t like the fact that a major China company was caught stealing. It is very hard to do business with that mindset.
It might be hard on China as well. Looking at the Shanghai chart pattern and there is a very definite head and shoulders that Friday looked as if it was rolling over from the right shoulder. Better get the PBOC and everyone else working on more stimulus right now.
That said, the US stock indices were not exactly looking rosy Friday. Of course, the US stock indices are trading just off all-time highs versus almost 50% off the 2018 highs. Nonetheless, there are some serious pattern issues for US stocks after the indices stalled at the prior highs three weeks ago.
Read “The Daily” Entire Weekend Summary
Watch Market Overview Video
Watch Technical Summary Video
Watch Next Session Video
Here’s a trade from “The Daily” and insights into our trading strategy:
Chart by StockCharts.com
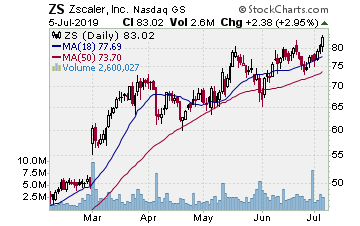
It was an up week with downside bookends Monday and Friday. That led to some upside gains and some downside gains, and it looks as if there will be more downside gains ahead.
ZS (Zscaler, Inc.)
Company Profile
Entered ZS on 4/25 as it moved up from a 50 day EMA test. Picked up the stock for $67.24 and some July $65.00 strike call options for $6.40. It was somewhat bumpy, but ZS managed to trend higher and thus we were able to let it work without too much anxiety in a market already filled with anxiety. It did make an intraday test of the 50 day EMA in early May, but that same day it reversed upside so letting a good play have a bit of leeway worked out. It really took off this past week, hitting the target on Thursday. We banked half the stock for $78.65, gaining almost 17%. We banked half the options for $16.50, a 155+% gain.
TGT (Target Corporation)
Company Profile
Moved in on the downside 5/1 as TGT made a big break lower from the 200 day MA. It gapped below it three sessions earlier, and we were ready when it turned down again, continuing the gap through support. We picked up some June $77.50 strike put options for $4.25. TGT then proceeded to work lower below the 10 day EMA for 8 sessions. Monday TGT gapped lower and sold hard. Tuesday it gapped again, sold, but started to hold at some support. That was our cue to take the gain. We sold the options for $7.60, banking over 75%.
Receive a 2 week trial and if you stay on receive a $30 per month discount!
2) STOCK SPLIT REPORT Here’s a leader play and our current analysis.
Chart by StockCharts.com
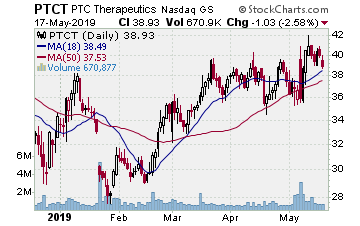
PTCT (PTC Therapeutics–$38.93; -1.03; optionable): Biotech
Company Profile
EARNINGS: 08/01/2019
STATUS: Cup w/handle. PTCT continues working on its pattern, breaking higher then testing last week. Same cup with handle from September 2018 we discussed before when we were looking to play PTCT, but now it is trading post-earnings. Earnings saw it gap and drop, but then immediately rebounded to just over the top of the handle. Faded to test in last week’s weakness, holding over the 20 day EMA, testing on lighter volume. We want to play a new break higher for a run at the September highs. That move gains 17% on the stock, 85% on the options.
CHART VIDEO
Volume: 670.877K Avg Volume: 784.565K
BUY POINT: $40.88 Volume=775K Target=$47.94 Stop=$38.55
POSITION: PTCT SEP 20 2019 40.00C – (50 delta) &/or Stock
Learn more about our Stock Split Report and how we have made gains of 321% with our powerful stock split plays!
Save $360 per year on the Stock Split Report! Plus 2 week trial!
Chart by StockCharts.com
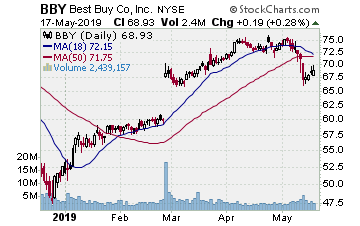
3) IH ALERTSBBY (Best Buy–$68.93; +0.19; optionable)
Company Profile
EARNINGS: 05/23/2019
STATUS: A short double top in April and early May, then a precipitous drop through Monday of last week. On that Monday drop BBY fell through the 200 day SMA and matched the early March low hit as BBY tested the upside earnings gap. Bounced up off that test through Friday, but looks to be stalling at the 200 day SMA. Earnings are Thursday before the open, and while BBY could break upside again on its results, it is a prime setup to gap back down from here. We like it enough to make that play and are looking to enter as BBY breaks lower off this bear flag. A move to the target gains 55%ish on the put options.
CHART VIDEO
Volume: 2.439M Avg Volume: 2.602M
BUY POINT: $67.92 Volume=3M Target=$61.42 Stop=$70.03
POSITION: BBY JUL 19 2019 67.50P – (-40 delta)
Save $600 per year and enjoy a 2 week trial of our IH Alerts Service!
Chart by StockCharts.com
4) SUCCESS TRADING GROUP–by the MarketFN STG Team
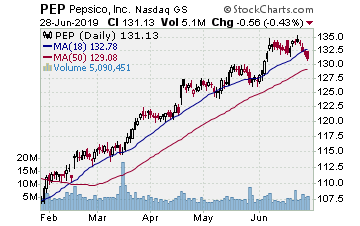
PEP (PepsiCo, Inc.) Company ProfileOur Success Trading Group opened a position in PepsiCo, Inc. (Ticker: PEP) on Wednesday. We will be watching closely for an exit on PEP and for new entry points on some of our favorite stocks.
Our Success Trading Group closed7 years with 0 losses on our Main Trade Table. In fact, we closed 100% winning trades for the calendar years 2016, 2015, 2013, 2012, 2011, 2010 and 2009. All of these trades are posted on our Main Trade Table for your review during your free membership trial period.
Get Our Next Trade Free – Save $50 per month! Details Here.
Chart by StockCharts.com
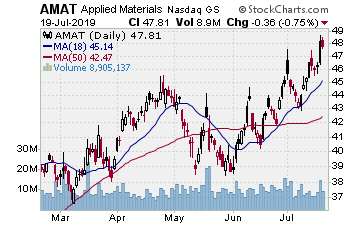
5) COVERED CALL PLAYAMAT – Applied Materials Inc. is currently trading at $42.70. The July $42.00 Calls (AMAT20190720C00042000) are trading at $2.60. That provides a return of about 5% if AMAT is above $42.00 on expiration Friday in July.
