No Time for the US to Back Off

THE WEEKEND ISSUE
Informing Investors Around The World
Read In All 50 States And Over 100 Countries
Weekend Newsletter for
January 20, 2019
Table Of Contents 1) MARKET SUMMARY from THE DAILY 2) STOCK SPLIT REPORT 3) IH ALERTS 4) SUCCESS TRADING GROUP 5) COVERED CALL SERVICE

1) MARKET SUMMARY > >From “The Daily” by Jon Johnson at InvestmentHouse.com
After an upside but somewhat disappointing Thursday, Friday was nothing but net.
– Indices move through next resistance as the third leg expands.
-Trade, Fed trump signs of slowing, some so-so earnings and some warnings.
-China injects massive liquidity, offers US $1T in purchases of goods. No time for the US to back off.
-Fed on the US’ side or not?
-More leaders setting up to support the move higher.
-Many are claiming bear market is over, but don’t forget that big top is still in place.
Market Summary (continued)
After an upside but somewhat disappointing Thursday, at least in terms of NASDAQ and the other indices still bumping the bottom of the October/December trading range, Friday was nothing but net. Renewed trade hope, Fed softening afterglow, and lingering positive bank earnings offset expiration, company layoffs, and weak consumer sentiment.
Stocks started higher and really never looked back. All indices cut well into the trading range, moving through the near resistance, putting distance on the resistance. That is key in turning resistance into support on a subsequent test — and indices and stocks almost always test.
VOLUME: NYSE +10%, NASDAQ +15%. NYSE volume moved over average for the first time in a while, just squeezing past. NASDAQ trade was up but still below average. Not exactly explosive volume on expiration.
ADVANCE/DECLINE: NYSE 2.9:1, NASDAQ 2.3:1.
Trade: China is offering purchases of $1T in US goods as a trade deal enhancer. China is at a point it has to deal. 1T yuan in liquidity injected into its financial markets last week in a desperate effort to get its economy going again. Rates for shipping commodities into China plunging, indicating China is not importing nearly the same quantities. Tariffs crushing its economy.
Now the key is what Trump does. This is very reminiscent of the Reagan/Gorbachev nuclear negotiations. Gorbachev knew his economy was imploding as the USSR could not keep up with the economic engine Reagan restarted and used to fund the US military. So, Gorbachev offered everything the US had said it wanted to that point. At that juncture, Reagan’s belief was confirmed — the US was winning the economically and thus militarily. He turned down Gorbachev’s offer. Why give up the benefits of a winning hand? We all know the outcome.
Read “The Daily” Entire Weekend Summary
Watch Market Overview Video
Watch Technical Summary Video
Here’s a trade from “The Daily” and insights into our trading strategy:
Chart by StockCharts.com
Stocks ran higher for the week, some early week, some late. By Friday the indices were clearing the last near resistance. We are buying and we are taking gain, but given the break over resistance, we were letting most positions run higher. CRON, CRM, WDAY, VRSN, AMZN — letting positions move higher. But, there are instances where you need to bank gain.
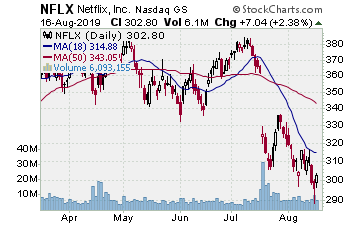
NFLX (Netflix, Inc.)
Company Profile
Earnings Thursday after the close. A very nice run higher on the week, gapping upside Tuesday, moving through the 200 day SMA. Held steady, and with earnings Thursday after the close we sold half the February $305 strike options purchased for $25.98 on 1/7 at $54.00. That banked a solid 107% gain right before earnings that took NFLX down to the 200 day MA.
NFLX was a momentum play. We saw it break higher over the 50 day MA on Friday 1/4, put on a play, and moved in the following week as it continued the move. Now we are watching how it tests the 200 day SMA and whether it gives us a new entry for another leg higher.
Receive a 2 week trial and if you stay on receive a $30 per month discount!
2) STOCK SPLIT REPORT Here’s a leader play and our current analysis.
Chart by StockCharts.com
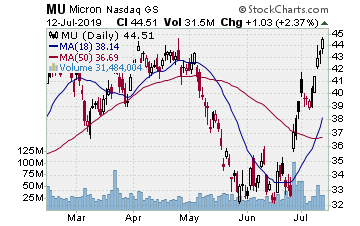
MU (Micron Technology–$35.76; +1.88; optionable): Semiconductors
Company Profile
EARNINGS: 03/19/2019
STATUS: If you can go about your business with bad news, you are likely going to be okay. MU has trended lower for some time. As with most chips it put in a lower low in late December, but as it did, MACD put in a higher low. It rallied up to the 50 day MA the second week of January, then earnings bounced it lower. But it didn’t fall far. MU tested, and Friday jumped back up to the 50 day MA on good volume. MU has formed something of an inverted head and shoulders, and if it can make the break higher from here then we like the play and we want to move in. A rally to the target lands a 95%sh gain on the options.
CHART VIDEO
Volume: 44.872M Avg Volume: 35.896M
BUY POINT: $36.02 Volume=40M Target=$42.45 Stop=$33.92
POSITION: MU APR 18 2019 35.00 C – (62 delta) &/or Stock
Learn more about our Stock Split Report and how we have made gains of 321% with our powerful stock split plays!
Save $360 per year on the Stock Split Report! Plus 2 week trial!
Chart by StockCharts.com
3) IH ALERTS
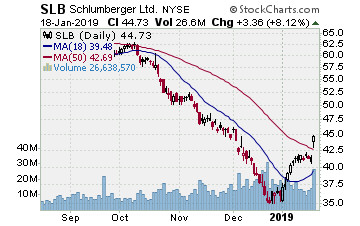
SLB (Schlumberger–$44.73; +3.36; optionable): Oil services
Company Profile
EARNINGS: 01/18/2019
STATUS: Trend reversal. Putting our money, again, where our mouth is as some oil services stocks post solid breaks higher. SLB reported earnings Friday morning and gapped over the 50 day EMA from a 1.5 week lateral consolidation. SLB trended lower forever it seems, the angle of decline really quickening from October. Bounced early January, moved up to below the 50 day, formed that lateral move, then gapped over the 50 day MA’s Friday. Solid. We want to play a continued move higher to the late October/early November lateral consolidation. That produces a nice solid move on the options well over 100%, 15%ish on the stock.
CHART VIDEO
Volume: 26.639M Avg Volume: 17.189M
BUY POINT: $44.91 Volume=18M Target=$51.55 Stop=$42.71
POSITION: SLB MAR 15 2019 45.00 C – (61 delta) &/or Stock
Save $600 per year and enjoy a 2 week trial of our IH Alerts Service!
Chart by StockCharts.com
4) SUCCESS TRADING GROUP–by the MarketFN STG Team
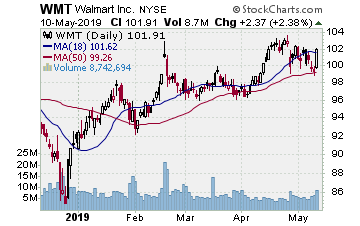
WMT (Walmart Inc.) Company Profile
Our Success Trading Group members will be looking to enter new positions next week. We have many stocks on our radar including Walmart Inc. (Ticker: WMT) and Intel Corp. (Ticker: INTC).
Our Success Trading Group closed7 years with 0 losses on our Main Trade Table. In fact, we closed 100% winning trades for the calendar years 2016, 2015, 2013, 2012, 2011, 2010 and 2009 (we still have 1 open position from 2017 (all others were winners) and 1 trade that we opened in 2014 was closed as a losing trade). All of these trades are posted on our Main Trade Table for your review during your free membership trial period.
Get Our Next Trade Free – Save $50 per month! Details Here.
Chart by StockCharts.com
5) COVERED CALL PLAY
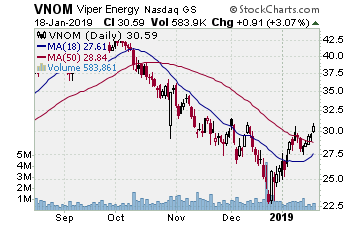
VNOM – Viper Energy Partners LP. is currently trading at $30.59. The March $30.00 Calls (VNOM20190316C00030000) are trading at $1.80. That provides a return of about 5% if VNOM is above $30.00 on expiration Friday in March.
