Pause That Refreshes or Start of Next Downside

THE WEEKEND ISSUE
Informing Investors Around The World
Read In All 50 States And Over 100 Countries
Weekend Newsletter for
December 30, 2018
Table Of Contents 1) MARKET SUMMARY from THE DAILY 2) STOCK SPLIT REPORT 3) IH ALERTS 4) SUCCESS TRADING GROUP 5) COVERED CALL SERVICE

1) MARKET SUMMARY > >From “The Daily” by Jon Johnson at InvestmentHouse.com
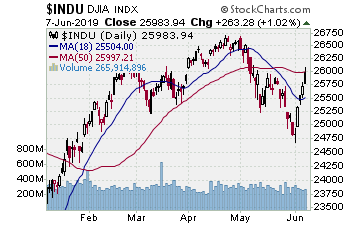
The week saw two big upside sessions, Wednesday and Thursday.
– Market tries higher again with an afternoon spurt that then fails.
-Indices at the 10 day EMA with doji after two days of rallying. Pause that refreshes or start of next downside is the question.
Market Summary (continued)
The week saw two big upside sessions, Wednesday and Thursday, as the internals and sentiment finally hit levels where all were in place for a bounce. The final key was VIX, and it finally broke through the recent highs and challenged the early 2018 closing high. Both Wednesday and Thursday were marked by very strong across the board buying, making it look very much as if pensions were buying across the market to reach the proper mix of equities to bonds as mandated by their charters. Thursday started much weaker but the buying started early afternoon and surged the indices positive with the Dow moving almost 900 points low to close. Lots of buying.
Friday stocks started higher but squandered the move by midmorning. Stocks sloshed around into early afternoon, but at 1:45ET the afternoon rally started like clockwork — as measured by Thursday — as pensions looked to buy more stock to rebalance their portfolios.
It was just like Thursday — until it wasn’t. At the start of the last hour stocks tested, tried to hold and bounce, but failed. They tumbled back to the session lows by the close, the rally coming and going in two hours.
Read “The Daily” Entire Weekend Summary
Watch Market Overview Video
Here’s a trade from “The Daily” and insights into our trading strategy:
Chart by StockCharts.com
As the market sold hard again Monday we banked some more downside gain.
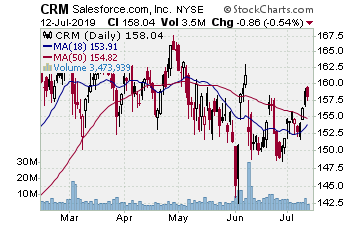
CRM (salesforce.com, inc.)
Company Profile
We entered CRM downside 12/17 as it gapped below the 200 day SMA. We picked up some February $130 strike put options for $7.54 as CRM sold. It was not straight downside, but CRM, despite ups and downs all week, hit the target Monday, 12/24, Christmas Eve. We sold the options for $13.55, banking almost 80%.
FFIV (F5 Networks, Inc.)
Company Profile
As the market bounced Wednesday, we took the rest of the gain on the downside plays on FFIV and SLAB, banking 70% and over 100%, respectively.
AMZN (Amazon.com, Inc.)
Company Profile
We entered an upside play on AMZN on Wednesday 12/26, picking up some February $1400 strike call options for $113.55. The next session AMZN opened a bit lower, moved up from there, but stalled. We opted to sell half the position for $141.10, banking a quick 25% gain. We left the rest and will see if AMZN can push past the 10 day EMA doji Friday and continue to return us some more gain.
Receive a 2 week trial and if you stay on receive a $30 per month discount!
2) STOCK SPLIT REPORT Here’s a leader play and our current analysis.
Chart by StockCharts.com
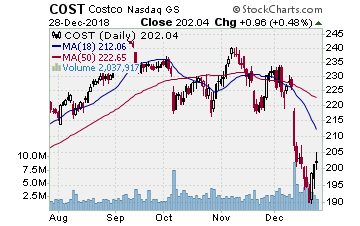
COST (Costco–$202.04; +0.95; optionable)
Company Profile
EARNINGS: 03/14/2019
STATUS: Bear flag. COST gapped lower out of its 3 month range, gapping and falling through the 200 day SMA mid-December. Sold to a lower low into Tuesday then rebounded with the market. Friday COST showed a tight doji below the 10 day EMA. If the market stalls its bounce here, COST is in great position to play the next move lower after that initial sharp breakdown from its range. A move to the initial target at the prior low lands a 55%ish gain on the put options.
Volume: 2.038M Avg Volume: 2.891M
BUY POINT: $199.55 Volume=3M Target=$190.11 Stop=$202.91
POSITION: COST FEB 15 2019 200.00 P – (-46 delta)
CHART IMAGE
Learn more about our Stock Split Report and how we have made gains of 321% with our powerful stock split plays!
Save $360 per year on the Stock Split Report! Plus 2 week trial!
Chart by StockCharts.com
3) IH ALERTS
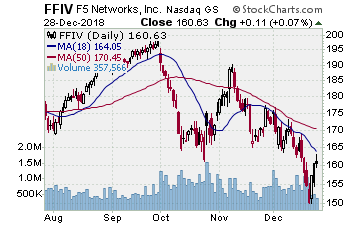
FFIV (F5 Networks–$160.63; +0.10; optionable): Software
Company Profile
EARNINGS: 01/23/2019
STATUS: Bear flag. Looking at another downside play on FFIV after it just made us money on the last drop. FFIV is in a larger, 6 month head and shoulders, breaking lower from the neckline in that December drop. Tuesday to Friday FFIV rebounded, tapping at the 20 day EMA on the Friday high before fading to a tombstone doji. If the market bounces is over FFIV is in great position to fall again. A move to the prior low lands a 75%ish gain, but there is also a gap that FFIV has not filled and that would take it near 148.
Volume: 357.566K Avg Volume: 692.58K
BUY POINT: $159.47 Volume=750K Target=$150.08 Stop=$162.84
POSITION: FFIV FEB 15 2019 160.00 P – (-46 delta)
CHART IMAGE
Save $600 per year and enjoy a 2 week trial of our IH Alerts Service!
Chart by StockCharts.com
4) SUCCESS TRADING GROUP–by the MarketFN STG Team
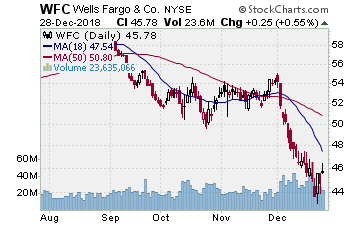
WFC (Wells Fargo & Company) Company Profile
Our Success Trading Group will be watching closely for entry points next week on some of our favorite stocks such as Wells Fargo & Company (Ticker: WFC) and Eli Lilly and Company (Ticker: LLY).
Our Success Trading Group closed7 years with 0 losses on our Main Trade Table. In fact, we closed 100% winning trades for the calendar years 2016, 2015, 2013, 2012, 2011, 2010 and 2009 (we still have 1 open position from 2017 (all others were winners) and 1 trade that we opened in 2014 was closed as a losing trade). All of these trades are posted on our Main Trade Table for your review during your free membership trial period.
Get Our Next Trade Free – Save $50 per month! Details Here.
Chart by StockCharts.com
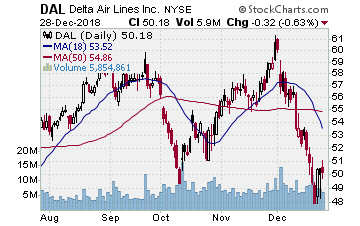
5) COVERED CALL PLAY
DAL – Delta Air Lines Inc. is currently trading at $50.18. The February $50.00 Calls (DAL20190216C00050000) are trading at $2.82. That provides a return of about 6% if DAL is above $50.00 on expiration Friday in February.
