PPI at a 6-Year High

THE WEEKEND ISSUE
Informing Investors Around The World
Read In All 50 States And Over 100 Countries
Weekend Newsletter for
November 11, 2018
Table Of Contents 1) MARKET SUMMARY from THE DAILY 2) STOCK SPLIT REPORT 3) IH ALERTS 4) SUCCESS TRADING GROUP 5) COVERED CALL SERVICE

1) MARKET SUMMARY > >From “The Daily” by Jon Johnson at InvestmentHouse.com
Friday saw stocks trade lower wire to wire.
– Friday finds no bids again as Wednesday follow through so far stands by itself.
-PPI at a 6 year high with prices +2.9% year/year.
-Trade worries, declining oil, low capital investment, rising prices are not signals of an economy heading higher.
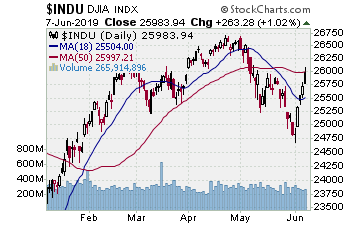
-SP500, DJ30 in excellent tests, NASDAQ needs work.
-This week we see if potential leaders can step up to support the past week’s follow through session.
Market Summary (continued)
The session started lower and trended lower in a very orderly decline into the afternoon session. There was a lot of ‘what the heck happened?’ commentary given the Wednesday surge and the utter failure to produce any upside Thursday or Friday. Plenty of concern and worry the market was going to give up the entire break higher — it did so on NASDAQ, filling the Wednesday gap and more at the session low.
A spurt of upside started 2 hours out from the close, bouncing the indices nicely off the session lows. Stocks lost some steam in the last 15 minutes or else the recovery would have looked pretty decent versus 1%+ losses.
SP500 -25.82, -0.92%
NASDAQ -123.98, -1.65%
DJ30 -201.92, -0.77%
SP400 -1.03%
RUTX -1.82%
SOX -1.85%
NASDAQ 100 -1.67%
VOLUME: NYSE +13%, NASDAQ -2%. NYSE trade moved up to average; some more selling but not heavy. NASDAQ trade faded as it sold off. Not a massive selloff.
ADVANCE/DECLINE: NYSE -3:1, NASDAQ -2.1:1. Fairly hefty downside breadth.
When all was done for the session the general notion is the rebound was rejected and the selloff continues. Perhaps, but the index patterns, particularly large cap NYSE — even NASDAQ 100 — despite falling, held together. The action was more a test of the Wednesday follow through.
Read “The Daily” Entire Weekend Summary
Watch Market Overview Video
Watch Technical Summary Video
Here’s a trade from “The Daily” and insights into our trading strategy:
Chart by StockCharts.com
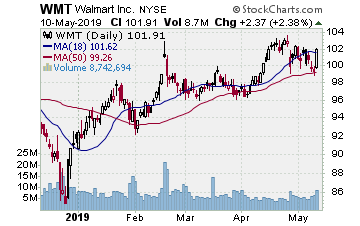
WMT (Walmart, Inc.)
Company Profile
After gapping upside on earnings in mid-August, WMT entered into a 2+ month lateral trading range. Tried to break higher mid-October, failed but held the 50 day MA. It continued to consolidate and we put it on the report after it tried higher late October but failed. The next session WMT made the move and we entered with some December $97.50 calls for $4.40. WMT was pretty much bulletproof after that, the only hiccup on Halloween as it sold after breaking higher the day before. It held the 10 day EMA then rallied straight on into Friday. After seven sessions upside straight, we opted to take part of the gain. Sold half the options for $8.80, banking a 100% gain less commissions.
MCD (McDonald’s Corporation)
Company Profile
Old standbys are working best in this market. We entered MCD on 10/29 as it broke higher off a 10 day EMA test. MCD broke higher 10/23, gapping upside and rallying. A 3-day test followed and we put it on the report. When MCD jumped again we entered with some January $175.00 strike call options for $6.95. MCD tested immediately yet again, but it held the 10 day EMA and bounced two Fridays back. It was straight up into the past Friday, gapping to a doji. Six straight upside sessions on low volume the last two of the week. We decided with the gap to the doji it was time to take some gain. We sold half the options for $12.40, banking just over 75%.
Receive a 2 week trial and if you stay on receive a $30 per month discount!
2) STOCK SPLIT REPORT Here’s a leader play and our current analysis.
Chart by StockCharts.com
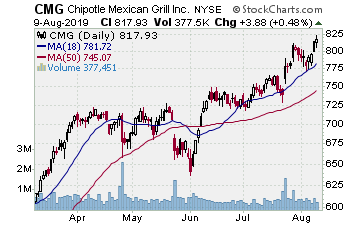
CMG (Chipotle Mexican Grill–$490.76; +12.46; optionable)
Company Profile
EARNINGS: 01/24/2019
STATUS: Friday CMG broke higher for a weeklong consolidation after clearing the 50 day SMA the prior week. CMG touched new highs in August before selling off into late October. It just undercut the late July lows then immediately reversed to start this latest move. CMG has set up something of an inverted head and shoulders as part of a cup base. With that break higher Friday we are ready to enter as CMG continues the move higher. A move to the target lands a 60%ish gain on the options.
CHART VIDEO
Volume: 891.882K Avg Volume: 769.094K
BUY POINT: $491.04 Volume=900K Target=$521.89 Stop=$481.21
POSITION: CMG JAN 18 2019 490.00 C – (54 delta)
Learn more about our Stock Split Report and how we have made gains of 321% with our powerful stock split plays!
Save $360 per year on the Stock Split Report! Plus 2 week trial!
Chart by StockCharts.com
3) IH ALERTS
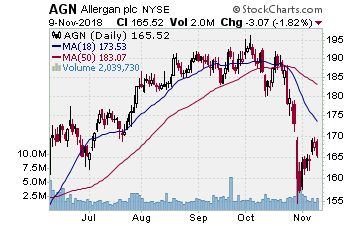
AGN (Allergan–$165.52; -3.78; optionable): Drugs
Company Profile
EARNINGS: 01/29/2019
STATUS: Bear flag. AGN rallied into August and continued into October in a very flat move over the 50 day MA’s. Broke lower in early October, recovered, but then broke again, falling through the 200 day SMA in late October with a strong move. Over the past week it has recovered to the 200 day MA. Thursday it paused, Friday it started back down on rising average trade. Looking to move in as AGN continues lower. A move to the target near the prior lows lands a 55%ish gain.
CHART VIDEO
Volume: 2.04M Avg Volume: 2.159M
BUY POINT: $164.88 Volume=2.3M Target=$155.56 Stop=$167.39
POSITION: AGN DEC 21 2018 165.00 P – (-46 delta)
Save $600 per year and enjoy a 2 week trial of our IH Alerts Service!
Chart by StockCharts.com
4) SUCCESS TRADING GROUP–by the MarketFN STG Team
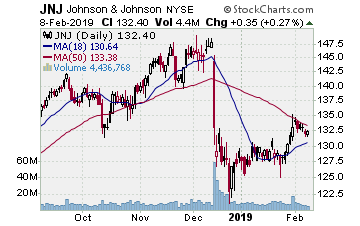
JNJ (Johnson & Johnson) Company Profile
Our Success Trading Group members scored another winning trade this week when we closed out a position in Johnson & Johnson (Ticker: JNJ). We are watching several stocks and are looking forward to trading next week.
Our Success Trading Group closed7 years with 0 losses on our Main Trade Table. In fact, we closed 100% winning trades for the calendar years 2016, 2015, 2013, 2012, 2011, 2010 and 2009 (we still have 1 open position from 2017 (all others were winners) and 1 trade that we opened in 2014 was closed as a losing trade). All of these trades are posted on our Main Trade Table for your review during your free membership trial period.
Get Our Next Trade Free – Save $50 per month! Details Here.
Chart by StockCharts.com
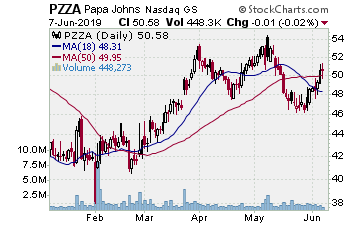
5) COVERED CALL PLAY
PZZA – Papa John’s International, Inc. is currently trading at $55.21. The December $55.00 Calls (PZZA20181222C00055000) are trading at $3.00. That provides a return of about 6% if PZZA is above $55.00 on expiration Friday in December.
