President Sets Off Expiration ‘Fireworks’

THE WEEKEND ISSUE
Informing Investors Around The World
Read In All 50 States And Over 100 Countries
Weekend Newsletter for
July 22, 2018
Table Of Contents 1) MARKET SUMMARY from THE DAILY 2) STOCK SPLIT REPORT 3) IH ALERTS 4) SUCCESS TRADING GROUP 5) COVERED CALL SERVICE

1) MARKET SUMMARY > >From “The Daily” by Jon Johnson at InvestmentHouse.com
Stocks started mixed, but with the uptrend they found bids and rallied positive, cruising into midmorning.
– Expiration ‘fireworks’ not about the market, but about the President.
– Market initially overcomes Trump on China trade, Trump on the Fed, but slides on his lawyer’s tape discussing a Playboy model payoff.
– High to low action, but a very quiet expiration.
– Large cap indices set up to move higher and with copious amounts of earnings results coming, they will have the ammo if they want to move.
– Finding plays not just ahead of earnings is a bit challenging right now, but some non-tech areas do look promising for the first time in a long time.
Market Summary (continued)
This despite Trump telling Joe Kernen China was a currency manipulator, undermining the gains in the US. As a result, Trump stated he was ‘ready to go’ on $500B of tariffs that would cover all Chinese goods.
Trump also had a beef with the Fed, stating Powell was a good man, but raising rates at this juncture when the US was making good progress was only driving up the dollar and making debt service costlier.
Oh my did the media go berserk. I had to change the channel away from CNBC even sooner than usual, moving over to a fairly liberal Bloomberg that was, by comparison, much tamer, much more attached to reality than the CNBC non-Kernen anchors. The female CNBC ‘news anchor’ was beside herself calling the President’s positions ‘crazy,’ also noting that the President wanted to CONTROL other agencies, giving the attorney general as an example. Well, of all the nerve, the President wanting to control an agency that is under the Executive Branch, i.e. an agency CONTROLLED by the President. The result of our schools forgoing teaching our children what the Constitution actually says even with respect to the very basic, three-branch governmental system, is showing. It was so bad that even some of the liberal guests (e.g. Jared Bernstein, former VP Biden’s economic advisor) had to chime in and say the President’s comments were just not that bad.
I know, I know, this sounds like a personal problem, but it is really a problem for everyone. News reporting that is passing itself off as unbiased but always taking the same side on every story, pursuing only one line of questioning. Failure of our education system to instill in our children the most basic understanding of why we are the country we are and how we formed and what truths we hold dear. Thus, we end up electing a socialist in New York who wants the federal government to oust private ownership of companies in favor of government control. A person who does not understand that the unemployment rate does not move lower because someone has two jobs instead of one. We are creating incredibly ignorant young adults, and equally ignorant young adults are electing them to office. My son fumes when I say such things, but he is well-versed in US history and economic history and is in the incredibly small minority of his peers who understand economic cause and effect.
The point: the market didn’t care about Trump’s tweets. China is manipulating its currency lower, despite the condition and its pledge upon joining the WTO that it would not, and it appears investors are taking this as a sign China is losing the trade war, a war that really has not yet started, that Trump has not yet begun to fight.
Read “The Daily” Entire Weekend Summary
Watch Market Overview Video
Watch Technical Summary Video
Watch Next Session Video
Here’s a trade from “The Daily” and insights into our trading strategy:
Chart by StockCharts.com
The continued move pushed some more plays to targets and we banked some solid gain.
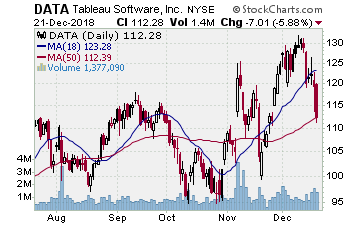
DATA (Tableau Software, Inc.)
Company Profile
We picked up this position 7/2 with stock at $99.71 and some August $100.00 strike call options for $6.10. This move saw DATA test the 50 day EMA after a new high in late June, and we wanted to play a rebound off that support as DATA was trending well, and after several runs up the 10 day EMA, the lower test ‘reset’ the move. DATA performed exactly as we wanted, with a steady move back up the 10 day EMA. It hit our target 7/18, at a new high. We sold stock for $110.65, an 11% gain, and options at $11.10, an 80+% gain.
HEAR (Turtle Beach Corporation)
Company Profile
We entered positions on HEAR 6/14 as HEAR extended a breakout. For a day. It then tested for two weeks to the 20 day EMA. Early July HEAR started upside with a slow but steady move. Very steady and on Thursday hit our target. We sold some stock for $26.75, banking 12%, sold some options for $6.9, banking a nice gain.
IMMU (Immunomedics, Inc.)
Company Profile
We still held some July $17 strike call options on IMMU bought way back on 4/30. The stock had moved very well, though slowly, over the prior three to four weeks. Usually don’t hold them this late, but the move was still good and Thursday IMMU spiked before it reversed off that move. We sold the rest of the options for $8.5 (bought at $2.9), banking a nice 190+%.
ISRG (Intuitive Surgical, Inc.)
Company Profile
We took half the gain the prior week as ISRG broke higher to a new high. We decided to hold half the position into earnings, and ISRG beat Thursday night. Friday it gapped higher and we banked the rest of the gain for a solid 100% gain.
Receive a 2 week trial and if you stay on receive a $30 per month discount!
2) STOCK SPLIT REPORT Playing stock splits can be very profitable, but it takes know-how. Our stock split service focuses on three main types of plays: 1) pre-announcement (where we forecast an upcoming split prior to the company making the announcement); 2) pre-split (these plays are made in the days leading up to the actual split day); and 3) post-split plays (plays made after the actual stock split where the stock is showing continued or renewed strength).
Listen to Stock Split Report Editor Jon Johnson’sstock split interview on CNBC-TV [ View Here ]
Here’s a leader play and our current analysis.
Chart by StockCharts.com
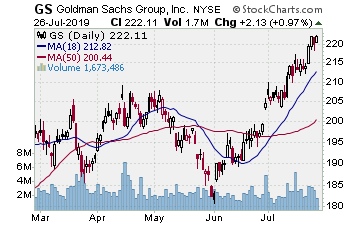
GS (Goldman Sachs–$231.69; +2.06; optionable)
Company Profile
EARNINGS: 10/16/2018
STATUS: GS rallied from September 2017 to January and March 2018 where it put in a double top. It rolled over from there, selling back to the lateral consolidation from summer 2017 where GS broke higher. A round trip. GS stair-stepped lower into late June/early July until it hit that prior consolidation. As it hit this level, MACD put in a higher low, its second one on this move, the first in late May. It looks as if GS is forming a short inverted head and shoulders, a pattern we have seen put in bottoms on many stocks. GS moved up to the 50 day MA’s on a solid earnings report and stalled, sliding laterally Wednesday to Friday to end the week. Not bad action at all, and we are looking at a trade upside toward the 200 day SMA as the initial target. That move lands a 65%ish gain on the call options, not bad for an initial move in a stock that looks to be turning the corner for at least some trades higher.
CHART VIDEO
Volume: 2.681M Avg Volume: 3.111M
BUY POINT: $232.48 Volume=4.8M Target=$243.45 Stop=$228.57
POSITION: GS SEP 21 2018 235.00 C – (44 delta)
Learn more about our Stock Split Report and how we have made gains of 321% with our powerful stock split plays!
Save $360 per year on the Stock Split Report! Plus 2 week trial!
Chart by StockCharts.com
3) IH ALERTS
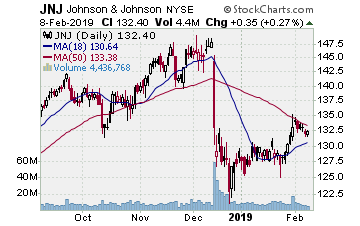
JNJ (Johnson & Johnson–$125.85; -0.09; optionable)
Company Profile
EARNINGS: 10/16/2018
STATUS: As with many stocks non-tech stocks, JNJ peaked in January and since that time has faded into a large, thus far year long base. In late May JNJ put in a lower low with a bit higher MACD low. It used that as the low in the base. In early July JNJ broke higher through the 50 day MA’s. On earnings day the past Tuesday, JNJ gapped upside to a higher recovery high. Nice move, but it could not hold it, fading into the Friday open and filling the gap as JNJ tested and held the 50 day MA. Looks as if JNJ is turning up off the bottom of a cup base, and we want to play the moves upside to form the right side of the base. Our initial target is just below the 200 day SMA. We want to play a break higher from this test. A move to the initial target lands a 90%ish gain on the call options.
CHART VIDEO
Volume: 5.835M Avg Volume: 6.787M
BUY POINT: $126.15 Volume=8.5M Target=$132.18 Stop=$124.13
POSITION: JNJ SEP 21 2018 125.00 C – (58 delta)
Save $600 per year and enjoy a 2 week trial of our IH Alerts Service!
Chart by StockCharts.com
4) SUCCESS TRADING GROUP–by the MarketFN STG Team
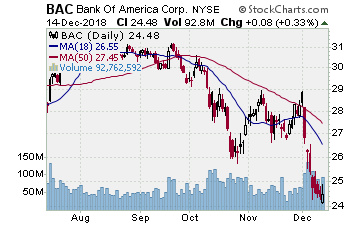
BAC (Bank of America Corporation) Company Profile
Our Success Trading Group will be watching closely for entry points next week. We currently like Bank of America Corporation (Ticker: BAC) at its current price for new positions.
Our Success Trading Group closed7 years with 0 losses on our Main Trade Table. In fact, we closed 100% winning trades for the calendar years 2016, 2015, 2013, 2012, 2011, 2010 and 2009 (we still have 1 open position from 2017 (all others were winners) and 1 trade that we opened in 2014 was closed as a losing trade). All of these trades are posted on our Main Trade Table for your review during your free membership trial period.
Get Our Next Trade Free – Save $50 per month! Details Here.
Chart by StockCharts.com
5) COVERED CALL PLAY
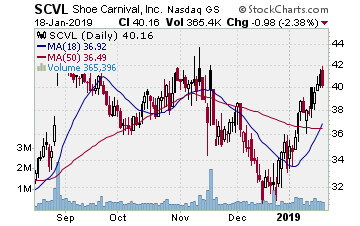
SCVL – Shoe Carnival, Inc. is currently trading at $31.63. The September $30.00 Calls (SCVL20180922C00030000) are trading at $3.00. That provides a return of about 7% if SCVL is above $30.00 on expiration Friday in September.
