Stocks do Poor Job of Trying to Move Higher

THE WEEKEND ISSUE
Informing Investors Around The World
Read In All 50 States And Over 100 Countries
Weekend Newsletter for
July 1, 2018
Table Of Contents 1) MARKET SUMMARY from THE DAILY 2) STOCK SPLIT REPORT 3) IH ALERTS 4) SUCCESS TRADING GROUP 5) COVERED CALL SERVICE

1) MARKET SUMMARY > >From “The Daily” by Jon Johnson at InvestmentHouse.com
Friday started out with promise with futures higher as a follow up to the Thursday upside.
– Stocks try to continue the Thursday move higher, do a poor job.
– Modest gains Friday fail to shake off the lack of bids, selling, leaving the character the same heading into the third quarter.
– Indices, key stocks still holding important support, thus far still unable to move higher.
Market Summary (continued)
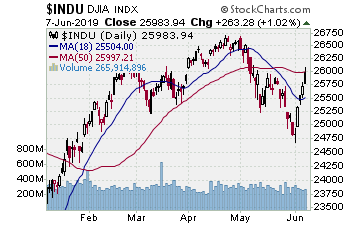
While the indices managed to close positive (for the most part — RUTX lower), the upside was really nothing by the close. Just more lateral movement over some key support for NASDAQ, RUTX, SP400, SP500 (50 day MA), the 200 day SMA for DJ30 and SOX. In short, nothing to change the status of the market as it tries to find footing at key support to continue the overall uptrend.
Alas, another week of indecisive action other than to hold support by the indices and many leading stocks. That in itself is not bad, and after 2 to 4 weeks of fading off the most recent highs, that is not the bad action many claim it to be, e.g. some saying it is the start of a new bear market. Seriously? Perhaps they are brilliantly prescient, but as for the patterns I see, there is some seriously good stocks in seriously good position. If the bids return at these classic bounce points, some seriously good moves could result.
That is the technical picture: testing important support after a move to new highs for many indices and stocks, still in the upside trend as they test.
Read “The Daily” Entire Weekend Summary
Here’s a trade from “The Daily” and insights into our trading strategy:
Chart by StockCharts.com
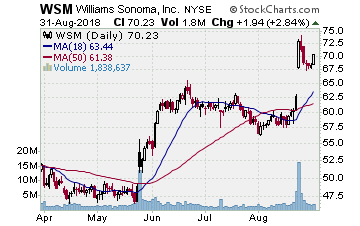
WSM (Williams Sonoma–$61.38; +0.07; optionable): Upscale cooking supply stores
Company Profile
EARNINGS: 08/22/2018
STATUS: Love going to WSM and buying eccentric items that are used perhaps once per year (e.g. my mango pitter). As I have said before, there are some good deals such as the wine glasses we picked up on clearance ahead of last Christmas. Anyway, WSM broke higher in late May with a gap (earnings) and run up to just over a week back. In the market selling it has tested, coming back to the 20 day EMA and working laterally the past week. Nice action, ready to move in as WSM breaks higher on solid volume, holds the move.
Volume: 1.06M Avg Volume: 2.452M
BUY POINT: $62.94 Volume=3M Target=$72.44 Stop=$59.91
POSITION: WSM NOV 16 2018 62.50 C – (53 delta) &/or Stock
CHART IMAGE
Receive a 2 week trial and if you stay on receive a $30 per month discount!
2) STOCK SPLIT REPORT Playing stock splits can be very profitable, but it takes know-how. Our stock split service focuses on three main types of plays: 1) pre-announcement (where we forecast an upcoming split prior to the company making the announcement); 2) pre-split (these plays are made in the days leading up to the actual split day); and 3) post-split plays (plays made after the actual stock split where the stock is showing continued or renewed strength).
Listen to Stock Split Report Editor Jon Johnson’sstock split interview on CNBC-TV [ View Here ]
Here’s a leader play and our current analysis.
Chart by StockCharts.com
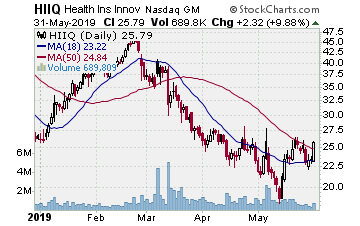
HIIQ (Health Insurance Innovations–$32.35; +0.25; optionable): Health care plans
Company Profile
EARNINGS: 08/01/2018
STATUS: HIIQ is testing the 50 day MA, fading the past three weeks as it forms the handle to a 4 month cup with handle base. This base formed after HIIQ rallied in February to early March. Really nifty pattern and HIIQ does not have to run far to make us a nice return on this play. The entry signal is a solid break higher on strong volume that holds the move.
Volume: 255.698K Avg Volume: 341.577K
BUY POINT: $32.66 Volume=450K Target=$38.74 Stop=$30.52
POSITION: HIIQ AUG 17 2018 30.00 C – (68 delta) &/or Stock
CHART IMAGE
Learn more about our Stock Split Report and how we have made gains of 321% with our powerful stock split plays!
Save $360 per year on the Stock Split Report! Plus 2 week trial!
Chart by StockCharts.com
3) IH ALERTS
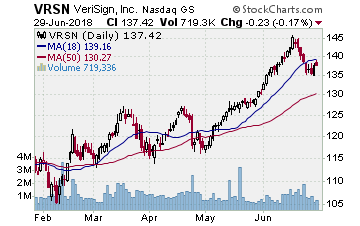
VRSN (Verisign–$137.42; -0.23; optionable): Domain names and more
Company Profile
EARNINGS: 07/26/2018
STATUS: Flag. VRSN still has the monopoly on certain parts of the internet, so we want to move in when the pattern gives an opportunity. As with many ‘name’ leaders using the recent market weakness to test new highs, VRSN has faded to the 20 day EMA and 38% Fibonacci retracement of the May to mid-June. Nice fade to the near support. The entry signal is a new break upside holding the move, decent volume. Looking for a run near the 127% Fibonacci extension.
Volume: 672.796K Avg Volume: 1.004M
BUY POINT: $138.97 Volume=1.4M Target=$151.38 Stop=$134.95
POSITION: VRSN SEP 21 2018 140.00 C – (48 delta) &/or Stock
CHART IMAGE
Save $600 per year and enjoy a 2 week trial of our IH Alerts Service!
Chart by StockCharts.com
4) SUCCESS TRADING GROUP–by the MarketFN STG Team
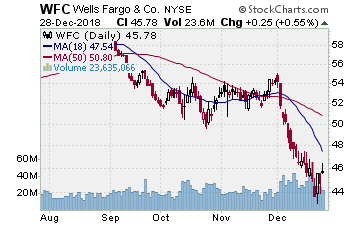
WFC (Wells Fargo & Company) Company Profile
Our Success Trading Group will be watching closely for entry points next week on some of our favorite stocks such as Wells Fargo & Company (Ticker: WFC) and Kellogg Company (Ticker: K).
Our Success Trading Group closed7 years with 0 losses on our Main Trade Table. In fact, we closed 100% winning trades for the calendar years 2016, 2015, 2013, 2012, 2011, 2010 and 2009 (we still have 1 open position from 2017 (all others were winners) and 1 trade that we opened in 2014 was closed as a losing trade). All of these trades are posted on our Main Trade Table for your review during your free membership trial period.
Get Our Next Trade Free – Save $50 per month! Details Here.
Chart by StockCharts.com
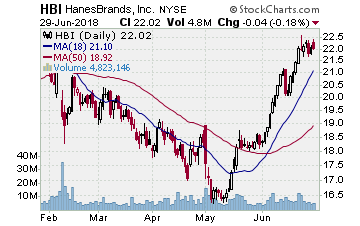
5) COVERED CALL PLAY
HBI – HanesBrands, Inc. is currently trading at $22.02. The August $22.00 Calls (HBI20180818C00022000) are trading at $1.15. That provides a return of about 6% if HBI is above $22.00 on expiration Friday in August.
