Trade Deal ‘More Likely Than Not’

THE WEEKEND ISSUE
Informing Investors Around The World
Read In All 50 States And Over 100 Countries
Weekend Newsletter for
February 24, 2019
Table Of Contents 1) MARKET SUMMARY from THE DAILY 2) STOCK SPLIT REPORT 3) IH ALERTS 4) SUCCESS TRADING GROUP 5) COVERED CALL SERVICE

1) MARKET SUMMARY > >From “The Daily” by Jon Johnson at InvestmentHouse.com
No trade deal announced, but the President and top Chinese negotiator in DC concurred there would likely be one.
– Stocks start stronger, fade after no trade deal, recover after President, China say trade deal likely.
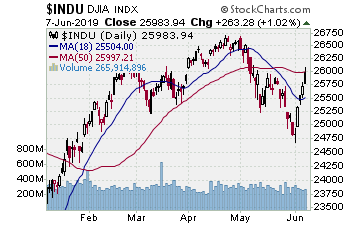
-Indices moving up to test the top of the range, SP400 is through the range, others trying to follow.
-Plenty of different groups vying for investment dollars, using some decent patterns as lures.
-Chips start higher again, software setting up again.
-Indices are certainly at resistance, but this far showing no signs of rolling over. As more solid stock patterns appear, they only reinforce an attempt to break through resistance.
Market Summary (continued)
No trade deal announced, but the President and top Chinese negotiator in DC concurred there would likely be one. The President stated a deal was ‘more likely than not,’ while the top Chinese negotiator opined an agreement would occur. Trump further said he and Xi would meet a Mar-A-Lago in March, again stating that only they could hammer out the final details of a deal.
Stock futures were higher and stocks opened higher, rallying into midday. After that, a slump into mid-afternoon took the indices back to the early session lows; still positive but well off the highs.
Then the announcements regarding trade. The word leaked that no deal was firmed up and that helped the selling. The President held a press conference and as the news percolated out, the comments from Trump and the Chinese lead negotiator hit. That news helped turn a midmorning to midafternoon slump into a rally back upside in the last 1.5 hours. The indices closed at or near session highs with the indices putting more moves on the October/December resistance.
Read “The Daily” Entire Weekend Summary
Watch Market Overview Video
Watch Technical Summary Video
Here’s a trade from “The Daily” and insights into our trading strategy:
Chart by StockCharts.com
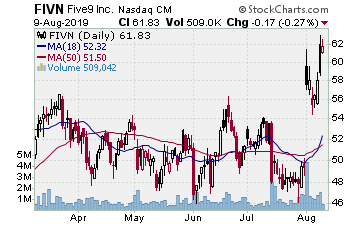
FIVN (Five9 Inc.)
Company Profile
Entered FIVN on 1/30 as it broke higher from a 5 month cup with handle base. We picked up the stock for $49.25 and April $50.00 strike call options for $4.3. Good breakout continued over the next several sessions, taking FIVN to over $53. Then it tested laterally as stocks do after a breakout, rallying again into this past week. Tuesday it announced earnings afterhours, and Wednesday gapped upside. That gap higher took FIVN past the target and we sold stock for $57.25, banking 16%. We sold the options at $8.50, banking close to 100%. Ironically, FIVN reversed the gap that session.
ROKU (Roku, Inc.)
Company Profile
Bought into ROKU on 2/6 as it looked as if it was ready to resume a break higher over the 200 day SMA. Picked up the stock for $48.28 and April $48.00 strike calls for $6.00. ROKU then faded below the 200 day SMA, but just for a session as it bounced around that level. It found footing and on 2/12 started a move higher. Rallied into this week, testing a bit on Thursday before its afterhours earnings release. Beat the street, and Friday ROKU gapped upside. Big. It surged 25% on the session, of course hitting our target along the way. The move was good for a 30+% gain on the stock. The call options are selling for almost $17.00 — a gain over 175%. We will see how far this breakout run takes it and then bank some solid gain.
Receive a 2 week trial and if you stay on receive a $30 per month discount!
2) STOCK SPLIT REPORT Here’s a pre-announcement play and our current analysis.
Chart by StockCharts.com
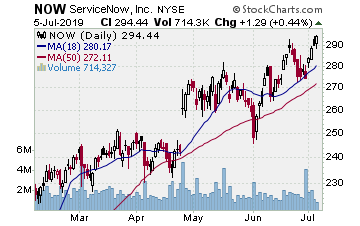
NOW (ServiceNow–$235.00; +4.99; optionable): Cloud software
Company Profile
EARNINGS: 05/01/2019
STATUS: Similar to TEAM, similar to WDAY, NOW hit a new high two weeks back and has worked laterally in a tight consolidation. You like to see a stock hold its gains as it consolidates a new move as that shows no one wants to sell it. It is simply idling while the bids rest and reset, preparing to drive it higher once more. NOW posted a tremendous gap in late January on its earnings, gapping the stock out of a 5 month base. What a gap. It rallied, and this lateral move is the test. Friday a good break higher on rising volume looked promising. Thus, we see if NOW can deliver a break higher once more, and if so, we like the potential to catch the next leg higher following this first test of the gap breakout. A move to the initial target gains 50% on the options.
CHART VIDEO
Volume: 1.981M Avg Volume: 2.22M
BUY POINT: $237.51 Volume=2.6M Target=$250.94 Stop=$233.18
POSITION: NOW MAY 17 2019 240.00 C – (49 delta)
Learn more about our Stock Split Report and how we have made gains of 321% with our powerful stock split plays!
Save $360 per year on the Stock Split Report! Plus 2 week trial!
Chart by StockCharts.com
3) IH ALERTS
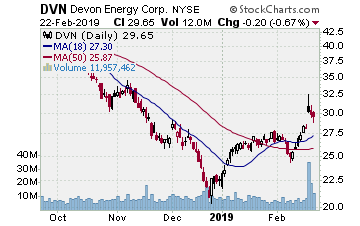
DVN (Devon Energy–$29.65; -0.20; optionable): Oil and gas
Company Profile
EARNINGS: 05/21/2019
STATUS: Most oil and gas stocks declined into December with other stocks, but the energy group has lagged in the recovery. Nonetheless, they are setting up good patterns and have not become overextended at all. DVN sold off into December and in doing so formed the head of a 3+ month inverted head and shoulders. Gapped upside Wednesday after edging up through the 50 day MA just before. Tested Thursday and Friday and likely tests a bit more to start the week. Nice solid breakout higher, however, and as it starts back up after completing this test we want to move in for a rally to the 35-36 range near the 200 day SMA. 17.5% on the stock to that target, over 100% on the options.
CHART VIDEO
Volume: 11.957M Avg Volume: 8.679M
BUY POINT: $30.24 Volume=12M Target=$35.54 Stop=$28.48
POSITION: DVN MAY 17 2019 30.00 C – (53 delta) &/or Stock
Save $600 per year and enjoy a 2 week trial of our IH Alerts Service!
Chart by StockCharts.com
4) SUCCESS TRADING GROUP–by the MarketFN STG Team
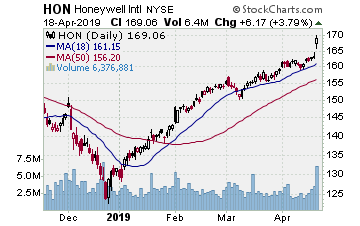
HON (Honeywell International Inc.) Company Profile
Our Success Trading Group will be watching closely for entry points next week. We currently like Honeywell International Inc. (Ticker: HON) at its current price for new positions.
Our Success Trading Group closed7 years with 0 losses on our Main Trade Table. In fact, we closed 100% winning trades for the calendar years 2016, 2015, 2013, 2012, 2011, 2010 and 2009 (we still have 1 open position from 2017 (all others were winners) and 1 trade that we opened in 2014 was closed as a losing trade). All of these trades are posted on our Main Trade Table for your review during your free membership trial period.
Get Our Next Trade Free – Save $50 per month! Details Here.
Chart by StockCharts.com
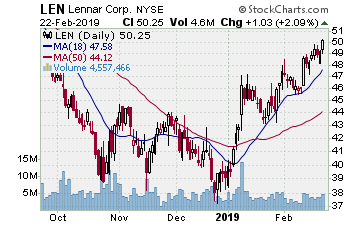
5) COVERED CALL PLAY
LEN – Lennar Corp. is currently trading at $50.25. The April $50.00 Calls (LEN20190420C00050000) are trading at $2.51. That provides a return of about 5% if LEN is above $50.00 on expiration Friday in April.
