US Economic Data Remains On and Off

THE WEEKEND ISSUE
Informing Investors Around The World
Read In All 50 States And Over 100 Countries
Weekend Newsletter for
March 3, 2019
Table Of Contents 1) MARKET SUMMARY from THE DAILY 2) STOCK SPLIT REPORT 3) IH ALERTS 4) SUCCESS TRADING GROUP 5) COVERED CALL SERVICE

1) MARKET SUMMARY > >From “The Daily” by Jon Johnson at InvestmentHouse.com
It would appear that new money did not wait for the new week.
– A week that tested resistance, faded, held support, then started back upside.
-Friday new money flowed in for the new month.
-US economic data remains on and off, but still expanding.
-China economics hurt then help stocks while a possible ‘remarkable, historic’ trade deal is hyped.
-Indices show no sellers and indeed more stocks are setting up very decent upside patterns.
-Indices now set to take on the range tops again.
Market Summary (continued)
March began Friday, and after a high-volume stagnant end to February, March blew in some solid index gains. After some rather tepid US economic data — yet again — many see the Fed’s easy money policy as appropriate, or that China’s on again/off again economic data (‘on’ Friday with better manufacturing data after Thursday’s extraordinarily weak import/export data) trumped the weaker US data. Or perhaps Larry Kudlow’s extolling the possibility of a “remarkable, historic” trade deal had something to do with it. Or, it was just time for new money to hit the market on a new month.
Whatever the cause or synergistic melding of events, stocks gapped higher, held the gap — at least after a morning dive back to near flat — and closed with some rather decent gains.
As far as the indices, there was not anything really new accomplished Friday. Last week the indices bumped resistance (or in SP400’s case, continued the break) then faded modestly. Friday’s new money injected new life, but as noted, did not break that resistance. Constructive action all week as the indices and stocks tested back to near support.
No breakouts Friday for the indices perhaps, but they tapped resistance, faded to near support, then got right back at it. Indeed, stocks such as GOOG broke out over some resistance and AMZN actually showed some life on much better volume after four weeks of dormancy. Many other stocks continue to move well or set up as well across many sectors and industries: software, chips, drugs, energy, healthcare — there is enough support to fuel a continued move and of course the breakout from the October/December range.
Read “The Daily” Entire Weekend Summary
Watch Market Overview Video
Watch Technical Summary Video
Watch Next Session Video
Here’s a trade from “The Daily” and insights into our trading strategy:
Chart by StockCharts.com
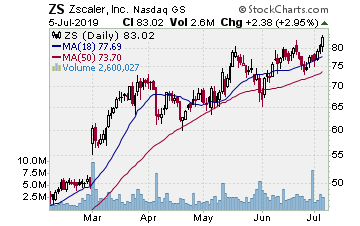
ZS (Zscaler, Inc.)
Company Profile
Entered ZS as it broke higher on 1/31 as the stock broke higher from a 5+ month cup with handle base. Picked up the stock for $48.25 and May $48.00 calls for $6.10. Nice break upside, good volume. Then . . . nothing much. Faded after a move higher, testing the 20 day EMA. Then a very slow move upside to the second week of February. Then a flat, flat, flat lateral move into this past week. Man, not going anywhere despite the nice base and strong breakout. Well, we decided to let it work into earnings given the great pattern and less than big run into earnings. Worked out. ZS gapped upside Friday and rallied to $60.57. Thank goodness; we were dying from boredom. In any event, ZS gapped and surged. We sold half the stock for $59.22, a 22% gain. Sold half the options for $13, banking 113%.
Receive a 2 week trial and if you stay on receive a $30 per month discount!
2) STOCK SPLIT REPORT Here’s a leader play and our current analysis.
Chart by StockCharts.com
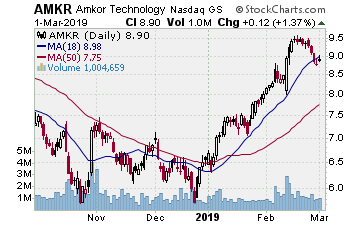
AMKR (Amkor Technology–$8.90; +0.12; optionable): Semiconductor integrated circuits
Company Profile
EARNINGS: 05/13/2019
STATUS: AMKR is engaged in a two-week test of the breakout from a double bottom base formed on the October and December lows. Surged off the 200 day SMA three weeks back, making the breakout move. Strong volume, strong breakout move over resistance. The test came back to the 20 day EMA Wednesday and has held, showing a doji Friday. MACD posted a nice new high on the break upside; plenty of momentum. Nice first test of the breakout, one of our favorite entry points. Want to see a good upside break with some volume to give us the entry signal. Plenty of room to run for a very nice gain.
CHART VIDEO
Volume: 990.01K Avg Volume: 1.067M
BUY POINT: $9.03 Volume=1.5M Target=$10.84 Stop=$8.42
POSITION: AMKR JUN 21 2019 9.00 C – (57 delta) &/or Stock
Learn more about our Stock Split Report and how we have made gains of 321% with our powerful stock split plays!
Save $360 per year on the Stock Split Report! Plus 2 week trial!
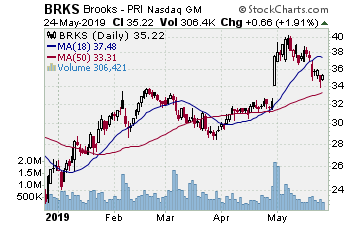
Chart by StockCharts.com
3) IH ALERTS
BRKS (Brooks Automation–$32.04; -0.07; optionable): chip equipment
Company Profile
EARNINGS: 05/07/2019
STATUS: BRKS is another chip stock testing the past two weeks to near support, this after a good rally that worked to form the right side of a base. After a gap higher in August 2018, BRKS peaked and fell right into the current 6 month base. The test the past to weeks to the 20 day EMA consolidates a good rally to mid-month. Waiting for a new break higher through the buy point to signal the entry. A move to the initial target near the August 2018 peak lands 20% on the stock, over 100% on the options.
CHART VIDEO
Volume: 504.17K Avg Volume: 569.48K
BUY POINT: $32.74 Volume=665K Target=$39.29 Stop=$30.56
POSITION: BRKS JUL 19 2019 32.50 C – (55 delta) &/or Stock
Save $600 per year and enjoy a 2 week trial of our IH Alerts Service!
Chart by StockCharts.com
4) SUCCESS TRADING GROUP–by the MarketFN STG Team
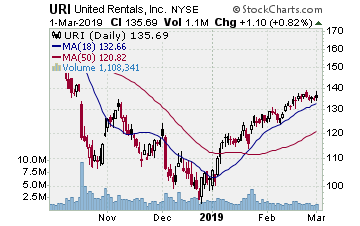
URI (United Rentals, Inc.) Company Profile
Our Success Trading Group will be watching closely for entry points next week on some of our favorite stocks such as United Rentals, Inc. (Ticker: URI) and The Travelers Companies, Inc. (Ticker: TRV).
Our Success Trading Group closed7 years with 0 losses on our Main Trade Table. In fact, we closed 100% winning trades for the calendar years 2016, 2015, 2013, 2012, 2011, 2010 and 2009 (we still have 1 open position from 2017 (all others were winners) and 1 trade that we opened in 2014 was closed as a losing trade). All of these trades are posted on our Main Trade Table for your review during your free membership trial period.
Get Our Next Trade Free – Save $50 per month! Details Here.
Chart by StockCharts.com
5) COVERED CALL PLAY
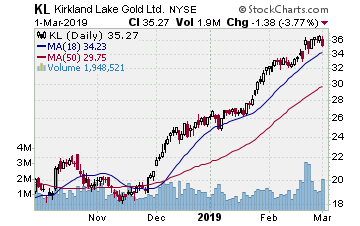
KL – Kirkland Lake Gold Ltd. is currently trading at $35.27. The April $35.00 Calls (KL20190420C00035000) are trading at $2.15. That provides a return of about 6% if KL is above $35.00 on expiration Friday in April.
