US Markets and Dollar are Solid

THE WEEKEND ISSUE
Informing Investors Around The World
Read In All 50 States And Over 100 Countries
Weekend Newsletter for
August 12, 2018
Table Of Contents 1) MARKET SUMMARY from THE DAILY 2) STOCK SPLIT REPORT 3) IH ALERTS 4) SUCCESS TRADING GROUP 5) COVERED CALL SERVICE

1) MARKET SUMMARY > >From “The Daily” by Jon Johnson at InvestmentHouse.com
The lira? More tariffs? Or, was it High Anxiety?
– Painfully slow session Thursday is triggered Friday by lira, falls from the highs.
– Trump takes advantage of Turkey’s bad policies and diving lira, doubles steel and aluminum tariffs.
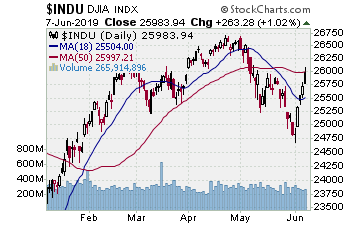
– World markets, currencies struggling, but US markets and dollar are solid. For now.
– US in a good position but the Fed can louse it up as . . . always.
– Once again new and higher highs are tossed. Indices remain in nice uptrends, but the New High Anxiety and damaged leader patterns are vexing.
Market Summary (continued)
Friday the lira was a turkey, crashing as Turkey’s problems go from bad to worse. Even so, Erdogan told the Turks to convert any dollars to lira, blustering ‘they have got their dollars, we have got our people, our right, our Allah.’
World markets were sharply lower and US futures followed. Then, still before the US bell, Trump added to Turkey’s woes, apparently seeing an opportunity to affect the release of the American pastor held captive by our ‘ally.’ Trump moved to double the recently enacted tariffs to 50% on steel, 20% on aluminum. You have to hand it to Trump: he plays for keeps, and while he keeps those across the negotiating table off balance, when he sees an opening, he takes it.
So stocks were going to open lower. They did. I predicted the indices would close higher than they opened. That would have been easily correct if the market only traded for the first two hours of the session. They gapped lower and immediately rose, recovering to 11:35ET. Then they gave it all back and more, selling lower and lower to mid-afternoon. A late bounce managed to close SP500, NASDAQ, SP400 over the open — barely. It was not much and certainly not the kind of recovery we had in mind.
Read “The Daily” Entire Weekend Summary
Watch Market Overview Video
Watch Technical Summary Video
Watch Next Session Video
Here’s a trade from “The Daily” and insights into our trading strategy:
Chart by StockCharts.com
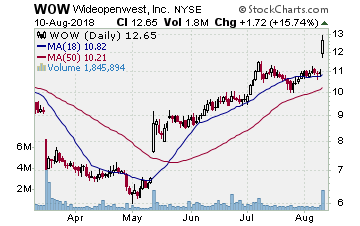
WOW (WideOpenWest, Inc.)
Company Profile
Always have our eye on new issues, and in July WOW formed a nice flag pattern over the 200 day MA after a nice rally. Put it on the report 7/27 then on 7/31 WOW broke higher over the upper channel line. We move in with just stock as the option spread was about a mile wide. Wow. It broke higher, we picked up the stock for $12.69. Then not much. A bit higher then a 6 day lateral move. Not much Wow factor. Then Friday it was wow. WOW gapped higher and surged 15+% on volume. Hit our initial target and we banked half the gain at $12.69, a 16% move. Not our best profit but an example of watching solid patterns and having them pay off even in a somewhat one step forward, half step back market.
Receive a 2 week trial and if you stay on receive a $30 per month discount!
2) STOCK SPLIT REPORT Playing stock splits can be very profitable, but it takes know-how. Our stock split service focuses on three main types of plays: 1) pre-announcement (where we forecast an upcoming split prior to the company making the announcement); 2) pre-split (these plays are made in the days leading up to the actual split day); and 3) post-split plays (plays made after the actual stock split where the stock is showing continued or renewed strength).
Listen to Stock Split Report Editor Jon Johnson’sstock split interview on CNBC-TV [ View Here ]
Here’s a leader play and our current analysis.
Chart by StockCharts.com
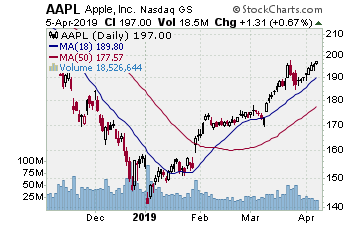
AAPL (Apple, Inc.–$207.53; -1.34; optionable)
Company Profile
EARNINGS: 10/30/2018
STATUS: Flag. Very straightforward pattern. AAPL gapped higher and rallied on earnings into early last week. It has since put in a tight, flat flag pattern waiting for the 10 day EMA to catch up. The 10 day is just about there and it often acts as the catalyst for the next leg higher. We want to play the next move higher when it sends AAPL up.
CHART VIDEO
Volume: 24.611M Avg Volume: 23.633M
BUY POINT: $209.84 Volume=28M Target=$230.00 Stop=$203.04
POSITION: AAPL NOV 16 2018 210.00 C – (49 delta) &/or Stock
Learn more about our Stock Split Report and how we have made gains of 321% with our powerful stock split plays!
Save $360 per year on the Stock Split Report! Plus 2 week trial!
Chart by StockCharts.com
3) IH ALERTS
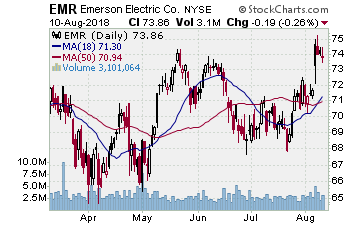
EMR (Emerson Electric–$73.86; -0.19; optionable): Electronics manufacturing
Company Profile
EARNINGS: Early November
STATUS: Cup w/handle. EMR is working in a longer term 8 month base, but the past 2 months it has formed a cup with handle. Nice strong break higher on earnings Tuesday, followed by a nice 1-2-3 handle formation through Friday. EMR can very easily be a leader in the next move higher; it is certainly set up to make that kind of move. We want to enter on a new break higher showing good volume. A move to the initial target lands a 90%ish gain on the call options.
CHART VIDEO
Volume: 3.1M Avg Volume: 2.9M
BUY POINT: $74.68 Volume=3.7M Target=$81.00 Stop=$72.57
POSITION: PFE DEC 18 2018 75.00 C – (41 delta) &/or Stock
Save $600 per year and enjoy a 2 week trial of our IH Alerts Service!
Chart by StockCharts.com
4) SUCCESS TRADING GROUP–by the MarketFN STG Team
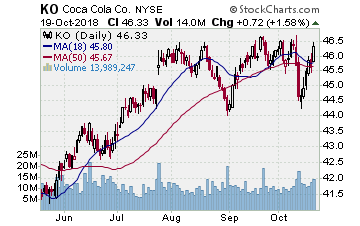
KO (Coca-Cola Company) Company Profile
Our Success Trading Group will be watching closely for entry points next week. We currently like The Coca-Cola Company (Ticker: KO) at its current price for new positions.
Our Success Trading Group closed7 years with 0 losses on our Main Trade Table. In fact, we closed 100% winning trades for the calendar years 2016, 2015, 2013, 2012, 2011, 2010 and 2009 (we still have 1 open position from 2017 (all others were winners) and 1 trade that we opened in 2014 was closed as a losing trade). All of these trades are posted on our Main Trade Table for your review during your free membership trial period.
Get Our Next Trade Free – Save $50 per month! Details Here.
Chart by StockCharts.com
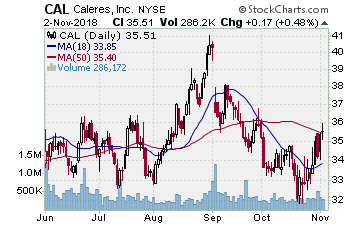
5) COVERED CALL PLAY
CAL – Caleres, Inc. is currently trading at $35.40. The September $35.00 Calls (CAL20180922C00035000) are trading at $2.10. That provides a return of about 6% if CAL is above $35.00 on expiration Friday in September.
