Weekend Issue For 6/23

THE WEEKEND ISSUE
Informing Investors Around The World
Read In All 50 States And Over 100 Countries
Weekend Newsletter for
June 23, 2019
Table Of Contents
1) MARKET SUMMARY from THE DAILY
2) STOCK SPLIT REPORT
3) IH ALERTS
4) SUCCESS TRADING GROUP
5) COVERED CALL SERVICE

1) MARKET SUMMARY
> > From Thursday’s paid content of “The Daily” by Jon Johnson at InvestmentHouse.com. To get his latest information and his daily content, click here now to receive a two-week trial and save $30/month. (You won’t find this offer on the Investment House website. It is exclusively for The Weekender subscribers!)
Market rallies despite no rate cut by the Fed.
S&P 500 hit a new closing high. All must be well.
There will be no rate cuts. The market is rallying on hopes of unconventional stimulus, not cuts.
The market is moving on stimulus hopes, not economic expansion. While this seems surreal, the surreal is now real just as the unconventional is now conventional.
Economics continue to erode.
The market has caught the new high, and now we will have to see if we can play more upside.
Market Summary (continued from above)
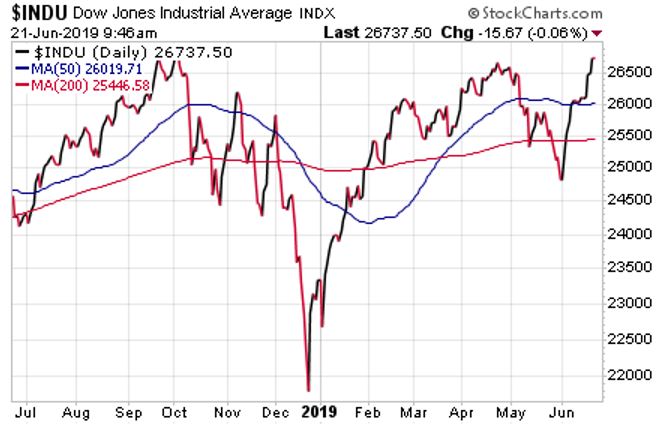
While an expected dovish Fed started the move, an actual dovish Fed appeared to seal the deal. The result was a new S&P 500 high and a great deal of rejoicing. Furthermore, the DJ30 gapped and rallied past the April highs that had just missed an all-time record before closing in on its own new high. The NASDAQ was on the way toward the old highs as well. Indeed, all of the indices advanced, showing solid moves even though not all of them are near new highs.
Who would have thought that slowing economic data and a Fed that was saying that it was watching to see if things would slow down would produce new highs? Well, perhaps there is a bit more than that.
There will be no rate cuts!
Recall that just a few weeks back, the erstwhile Federal Open Market Committee (FOMC) chairman who is now the toast of Wall Street said that unconventional Fed tools would be used again in the future. So, why call them unconventional? THIS is what the market is currently focusing on.
Remember, Powell does not want to cut rates. In October, he had made it clear that he felt that rates need to be higher. If he feels that there are other means to achieve stimulus without cutting rates, e.g. the tools formerly labeled as unconventional, Powell will opt for those now conventional unconventional tools over rate cuts. As we saw starting in March 2009, those tools, even though they are unconventional, are a very powerful stock propellant.
DJ30: Roughly 200 points from the high. It will probably gap, test and then rally to close near the session high. However, it is working well after the breakout from the week-long lateral range that had measured the hold highs.
SP400: Gapped nicely over resistance and held onto most of the move. It is still in no-man’s land, nowhere near a high, but at least working out of the selloff.
RUTX: Gapped to a tight doji. This is great. While it is still miles off the high, at least it has, as they say, room to run.
NASDAQ: Gapped, tested and then closed below the opening price. While this is not the best course of action, at this level, nothing is really believable. It just is. I know that this sounds really zen, but this rally is built on hopes of stimulus, not on solid economic expansion. Of course, that is the way things have been for nine years. I suppose the surreal is now the real, just as the unconventional is now conventional. In any event, reality states that the NASDAQ is 125 points from a new all-time high.
SOX: Gapped to just below the 50 day MA and then gave up a chunk of the move. However, it did make it to the high it had achieved the previous June — where it had gapped on the open and then faded as well. This is not the most comforting of patterns.
NOTE: The figures and information above are from the 6/20 report.
NOTE: All videos are as of the 6/19 report.
Here are two trades from “The Daily” and insights into our trading strategy:
Chart by StockCharts.com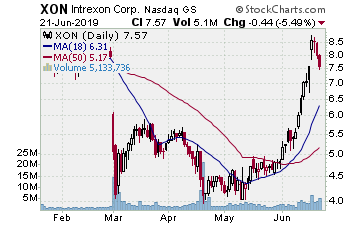
XON (NASDAQ:Intrexon Corp.)
Company Profile
At times, great plays come from lower priced stocks and stocks that have been despised and spat upon. XON is a stock that we used to play upside quite a bit as it would fly when it got going. That changed after a massive run in 2015. It fell off the radar along the way. At the time that XON bottomed out, we were looking at some biotech companies as there was some volume in the sector.
While I’m not saying that this is the bottom of bottoms, the stock was putting in a very tradeable bottom this year. It gapped lower three times and then did not go lower while the MACD ran higher on a test of the low. It then broke the 50 day MA. Then, we put it on the report. The fact that we bought the stock on 6/11 for $5.84 was perfect timing since XON started higher and continued running into Wednesday of this week. On 6/14, it hit our initial target and showed a tombstone doji. We then sold the position for $7.07, banking 21%.
The other half that we had left behind to work experienced good volume and lots of momentum. Thus, we speculated that it was not done. It was not. It jumped higher during the next session then gapped and rallied to the 200 day SMA on Tuesday. We waited until Wednesday to see if any momentum was left, but it showed another doji below the 200 day SMA. We decided to pull the trigger, selling the rest for $8.54 and banking over 45%. While this was a small price, it showed volume moving in when everything came together. Not all great trades start with A — as in AMZN, ADBE, AAPL, AMT — you get the idea.
TWLO (NYSE:Twilio)
Company Profile
Chart by StockCharts.com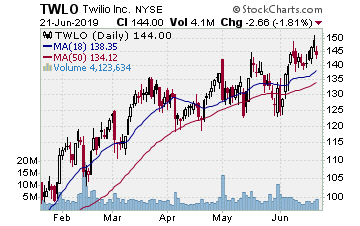
TWLO displayed some of the indecisiveness in the software group right now. After trying our patience it came through — mostly. The sellers tried to take TWLO down in early June, selling it through the 50 day MA — hard. As fast as they sold it, however, TWLO reversed, gapping back over the 50 day MA. That was our signal and we put it on the report — whenever a breakout is sold hard or a breakdown rebounds hard, those who had pushing the initial move have lost.
When TWLO tested the next session and started back up, we moved in with some stock at $136.33 and some August 135.00 strike call options for $14.70. While this was absurdly pricey, this stock can fly. It did and then didnât.
The stock rallied during the next session and surged to a new high on 6/10. Although it looked great, it reversed that session and flattened. TWLO then twiddled its thumbs for five sessions while testing back to the 10 day EMA. Frankly, this was a very nice test. As you would expect, it moved higher from there. It gapped on the upside Tuesday, but then faded during much of the move. It rallied nicely on Wednesday after the FOMC and gapped sharply higher on Thursday . . . it then started to fade. Finally, TWLO ended up giving all that move back. However, it hit our target during that move. When we saw it gap, edge higher and then stall, we sold. The movement was just too back and forth and too indecisive. We also had a gain — albeit not a huge one — in hand. Thus, we sold the stock for $148.14 and a not so huge 8.8% gain. We also sold the options for $21.00 and achieved a more respectable 42% gain, albeit not what we wanted out of it.
Receive a 2 week trial and if you stay on receive a $30 per month discount!
2) STOCK SPLIT REPORT
Here’s a leader play and our current analysis.
Chart by StockCharts.com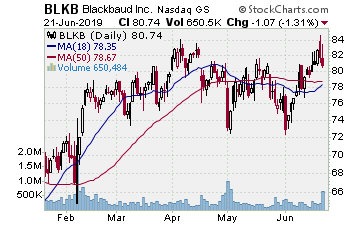
NASDAQ:BLKB (Blackbaud–$82.68; +1.75; optionable): Software for Nonprofits
EARNINGS:07/30/2019
STATUS: After a severe selloff from the late July 2018 peak, including a massive gap lower in October that year, BLKB has formed a three month range. This week, it broke out of that consolidation, sporting some solid volume. We want to play a move to fill that gap. That moves will gain 70%ish on the call options and 8+% on the stock.
VOLUME: 196.261K Avg Volume: 262.277K
BUY POINT: $82.79 Volume=300K Target=$89.97 Stop=$80.46
POSITION: BLKB SEP 20 2019 80.00C — (54 delta) &/or Stock
Learn more about our Stock Split Report and how we have made gains of 321% with our powerful stock split plays!
Save $360 per year on the Stock Split Report! Plus 2 week trial!
Chart by StockCharts.com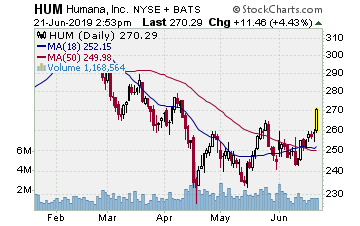
3) IH ALERTS
NYSE:HUM (Humana — $256.79; -1.16; optionable): Health care plans.
Company Profile
EARNINGS:07/31/2019
STATUS: HUM gapped and rallied to a new high in early November 2018 and then stopped moving. It sold off from there into mid-April 2019. After bottoming at that point, the share price started working back upside. Over the past four weeks, HUM consolidated a good move higher in order to form a short double bottom with handle pattern. The price broke higher Tuesday and tested on Wednesday. As HUM breaks higher and clears the highs from the past two sessions, we will move in. A rally to the target will gain 80%ish on the options, 7.5% on the stock.
VOLUME: 732.824K Avg Volume: 1.466M
BUY POINT:$259.42 Volume=2M Target=$279.77 Stop=$252.88
POSITION: HUM AUG 16 2019 260.00C — (44 delta) &/or Stock
Save $600 per year and enjoy a 2 week trial of our IH Alerts Service!
Chart by StockCharts.com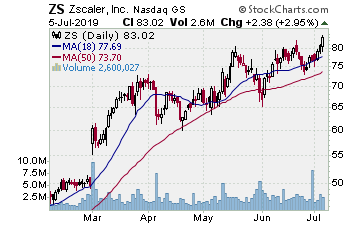
4) SUCCESS TRADING GROUP
— by the MarketFN STG Team
NASDAQ:ZS (Zscaler)
Company Profile
Our Success Trading Group members scored another winning trade this week when we closed out a position in Zscaler. (NASDAQ:ZS) We are watching other several stocks and are looking forward to trading next week.
Our Success Trading Group closed seven years with zero losses on our Main Trade Table. In fact, we closed 100% winning trades for the calendar years 2016, 2015, 2013, 2012, 2011, 2010 and 2009. We still have one open position from 2017 (all others were winners) and one trade that we opened in 2014 but was closed as a losing trade.
All of these trades are posted on our Main Trade Table for your review during your free membership trial period.
Get Our Next Trade Free – Save $50 per month! Details Here.
Chart by StockCharts.com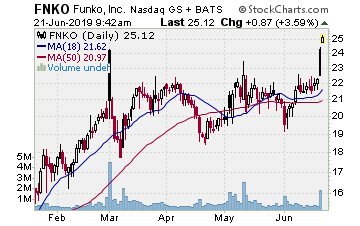
5) COVERED CALL PLAY
NASDAQ:FNKO — Funko is currently trading at $24.25. The July $25.00 Calls (FNKO20190720C00025000) are trading at $1.05. That provides a return of about 5% if FNKO is above $25.00 by the time of the expiration.
Learn more about our Covered Call Tables
PREMIUM SERVICES
IH Alerts: InvestmentHouse.com’s Best of The Best Plays!
Stock Split Report: Forbes.com Best of the Web
Covered Calls: Allowed in your IRA – Energize your portfolio!
The Daily: “The Daily” is a must read for all investors!
Success Trading Group: 7 years without a trading loss!
The foregoing is commentary for informational purposes only. All statements and expressions are the opinions of Online Investment Services, LP., or Split Ventures, Ltd. This information is not meant to be a solicitation or recommendation to buy, sell, or hold securities. We are not licensed or registered in the securities industry. The information presented herein and on the related web site has been obtained from sources believed to be reliable, but its accuracy is not guaranteed. The security portfolios of writers for this issue may, in some instances, include securities mentioned herein and on the related web site. Estimates, assumptions and other forward-looking information are subject to the limits of forecasting. Actual future developments may differ materially due to many factors. No one associated herewith receives compensation in any manner from any of the companies that are discussed in this newsletter or on the related websites.
