Weekend Issue for 6/30

THE WEEKEND ISSUE
Informing Investors Around The World
Read In All 50 States And Over 100 Countries
Weekend Newsletter for
June 30, 2019
Table Of Contents
1) MARKET SUMMARY from THE DAILY
2) STOCK SPLIT REPORT
3) IH ALERTS
4) SUCCESS TRADING GROUP
5) COVERED CALL SERVICE
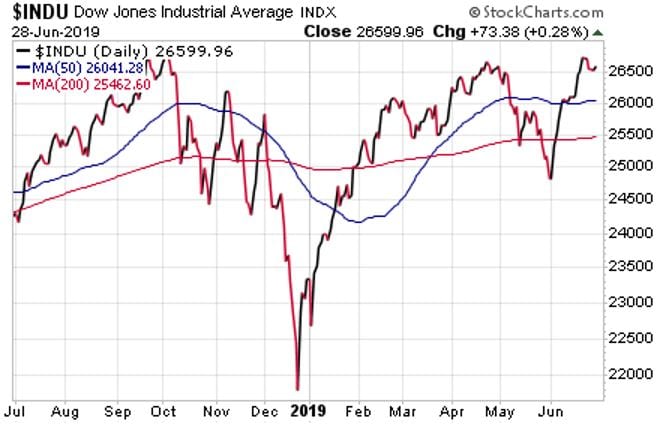

1) MARKET SUMMARY
> > From Thursday’s paid content of “The Daily” by Jon Johnson at InvestmentHouse.com. To get his latest information and his daily content, click here now to receive a two-week trial and save $30/month. (You won’t find this offer on the Investment House website. It is exclusively for The Weekender subscribers!)
Investors eagerly watch for the results of the G20 Summit.
Stocks moved from lower prices to higher prices on the day, but it the move was not that powerful.
All eyes are on the G20 and the China-U.S. trade discussions.
While there have been some modest moves, there were also good constructive pullbacks on the large cap indices.
Midcaps and small caps have posted very solid gains, but there still are problematic patterns.
Trade talks are paramount in the near term, while Fed action weighs heavily in the short term.
Market Summary (continued from above)
On Wednesday, there was trade-related news as Treasury Secretary Mnuchin pandered to markets again with his oft-repeated “90% done” description of the trade negotiations. The market bought into it for a half an hour premarket and then decided that Mnuchin was the Treasury Secretary who cried “trade deal” once too often. President Trump chimed in, saying that he may implement just 10% in tariffs instead of 25% on the other $300 billion in Chinese goods. Wow! Good will and good cheer all around.
As for economics, Durable Goods Orders for the month of May dropped 1.3% even though a drop of only 0.3% was expected. At least that was better than April’s 2.8% drop (from an expected 2.1% dip). However, when we take out Boeing, the number of orders rose 0.3% (0.1% expected), up from -0.1%. Core capital goods rose 0.7%. While this is not great as the data are not showing much improvement, it is not the kind of data that confirm that the Fed is doing nothing. Of course, the Fed has said that it will do nothing as of Tuesday, thanks to Bullard and Powell.
Those stories were interesting, but they had no staying power. The one story that did report that Micron Technology Inc.’s (MU) earnings that were solid (considering what had been expected). MU gapped upside and rallied more than 13%, dragging a lot of chip stocks higher with it, such as Nvidia, Applied Materials Inc. and so on. Indeed, SOX rose 3.2% and the chips are why the NASDAQ and the NASDAQ 100 closed modestly positive. Without that news, I am not too sure that any indices would be up.
DJ30: Despite being lower, the DJ30 shows an excellent setup following a test this week off of last week’s high. The nice tight doji at the 10-day estimated moving average (EMA) looks promising for a bounce and even a try at the all-time high.
S&P 400: The S&P 400 posted a solid move gap to a doji higher after a four-session decline from the prior Thursday. Then, the stock gapped lower and held near the 50-day EMA in a solid bounce. It would be great to see the mid- and small-caps surge back up, but the S&P 400 is still looking at the pretty impressive head and shoulders pattern that it had managed to form the past five months.
Russell 2000: Posted a nice move back up through the 50-day MA. I am also really glad to see that RUT did not continue lower and break down once more. That said, the Russell 2000 stocks have a lot more to do in order to overcome the same head and shoulders pattern that the S&P 400 faces.
NASDAQ: It gapped upside, held for most of the move and experienced a second upside session after a three-day drop to the 50-day MA by Tuesday’s close. For a second session, the semiconductors aided NASDAQ’s rise, but it also received help from some software and some FAANG (Facebook, Alphabet’s Google, Apple, Amazon, Netflix) stocks. This was not a bad action, but it was also not that convincing to the upside, given that NASDAQ has ridden on semiconductors for its bounce on the past two sessions. While this is still an impressive top overhead, it will need more than just the chips to hit new highs.
SOX: It managed to gap through the twin highs that had stopped it before and also moved up through the 50-day SMA as well. Then, it had a nice breakout in anticipation of a U.S.-China trade deal after experiencing an awful lot of rebounding over the past two sessions by betting on that outcome. While this may have been a good move, if a deal does not happen, SOX will be gone quickly.
NOTE: The figures and information above are from the 6/26 and 6/27 reports.
NOTE: All videos are as of the 6/25 report.
Here are two trades from “The Daily” and insights into our trading strategy:
Chart by StockCharts.com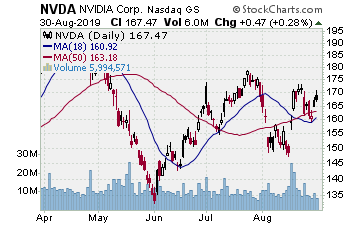
NVDA (NASDAQ:Nvidia Corp.)
Company Profile
After a steady selloff from late April to early June, NVDA started to recover early this month. The stock experienced some good volume off the low, followed by a four-day test of that initial move â- right along with the overall marketâs lateral consolidation of that first move. We put the play on the report on 6/6. While we missed the first move as NVDA gapped away, the test of that move is what gave us the opportunity. On 6/18, NVDA gapped upside and we moved in. We bought some stock at $155.23 and some August $155.00 strike call options for $12.40.
That day was a big day for the stock as NVDA continued up to the 50-day EMA through. It experienced a nice test into Tuesday, holding the 10-day EMA near support. On Wednesday, a nice gap higher this time took NVDA over the 50-day EMA. This strong volume was nice. On Thursday, NVDA gapped over the 50-day SMA on still good trade.
It gapped to a doji and touched the initial target. When this happened, we stuck to the plan and sold half of our options for $18.70, banking just over 50%. We also sold some stock for $164, banking 7%. Now, we plan to let the rest of the position work in order see if it will fill more of those gaps.
PEP (NASDAQ: PepsiCo. Inc.)
Company Profile
Chart by StockCharts.com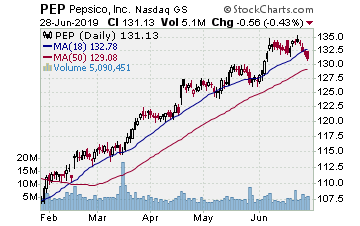
PEP is making a solid, steady move using the 20-day EMA as support after breaking out of a cup with a handle-base in mid-March. We love playing these solid moves each time the stock tests back to that near support. Stocks tend to make four to five bounces off that support before testing deeper to the 50-day moving average (MA) in order to try and reset the move for another rally up to the moving averages.
In late May and early June, PEP tested the 20-day EMA for the third time during this move. Thus, we were looking at playing it again. After seeing a good break higher off the 20-day EMA, we entered with some August $130.00 strike call options for $4.35. After a good break higher, the stock came close to the target and then backed off over and over again.
It fell back to the 20-day EMA by 6/19, then found support and bounced back during that session. The rise continued higher into Monday and touched off the target. Given the number of rotations, we went ahead and banked our gains by selling the calls for $5.90 and a 35% gain. While this is not massive, then again, it was a bounce play off the 20-day EMA a bit late in the rally. In that light, 35% works.
Receive a 2 week trial and if you stay on receive a $30 per month discount!
2) STOCK SPLIT REPORT
Here’s a leader play and our current analysis.
Chart by StockCharts.com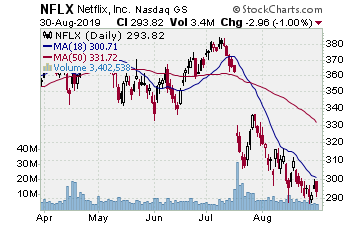
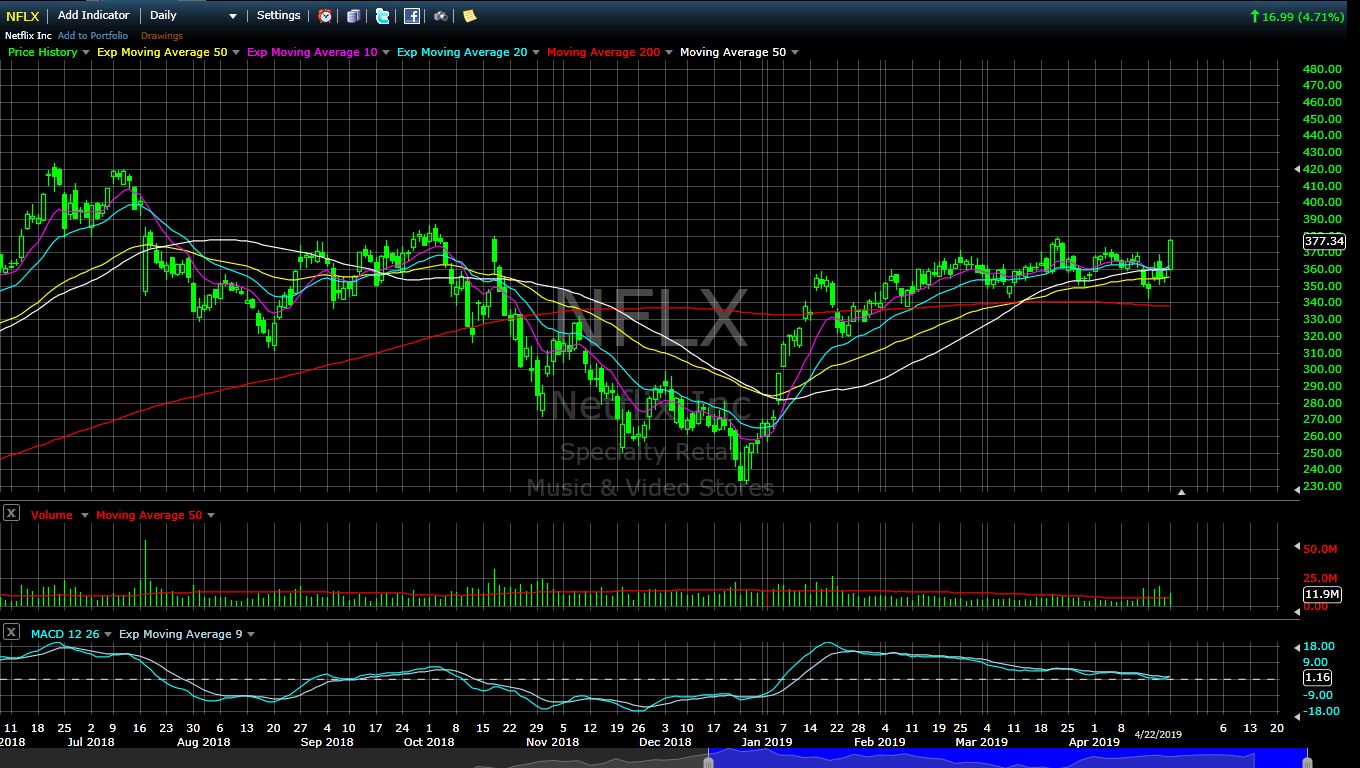
NASDAQ:NFLX (Netflix–$362.20; +1.89; optionable): Video Streaming
EARNINGS:07/17/2019
STATUS: Since recovering off the December low, NFLX has traded in a roughly 40 point range. The bottom of the range is fairly consistent at the 200-day SMA. NFLX has made a number of rolls in the range of four to six, depending upon what you want to call a roll. Regardless, it has put in about as many rolls as a stock normally does before making a breakout move that could go either up or down. What we like about NFLX is that it touched the top of the range during this last move and then faded to the 50-day MA. Often, a test of this MA will lead to a breakout move. Thus, if it will hold and make a good break higher, we want to play for a breakout move. There is a gap from mid-July 2018 to the downside, and the initial target is a fill of that gap. Earnings are not far off, but NFLX has put in the time, is not overbought and we like the setup for that move. That rally will gain us 65% on the options and around 8% on the stock.
VOLUME: 3.67M Avg Volume: 5.617M
BUY POINT: $366.81 Volume=8M Target=$395.65 Stop=$357.47
POSITION: NFLX AUG 16 2019 365.00C — (52 delta) &/or Stock
Learn more about our Stock Split Report and how we have made gains of 321% with our powerful stock split plays!
Save $360 per year on the Stock Split Report! Plus 2 week trial!
Chart by StockCharts.com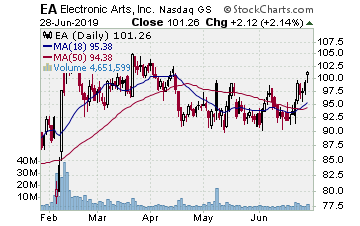
3) IH ALERTS
NYSE:EA (Electronic Arts — $97.32; +0.41; optionable): Gaming software
Company Profile
EARNINGS:08/06/2019
STATUS: Gaming stocks are improving after a long dormancy. EA peaked in July 2018 and sold very hard into Christmas before splitting 2:1 the hard way. It then bottomed and rallied into February where it peaked again. Thus, over the past five months, EA has formed a triangle. On Monday, it gapped over the 200-day SMA and the upper trendline to the triangle, sporting a very solid post-expiration volume. After testing on Tuesday and Wednesday, the stock showed a nice doji with a tail on Wednesday. This is a very nice setup, so we want to move in as EA breaks higher off of this breakout test. A move to the target will gain around 10% on the stock and around 100% on the options.
VOLUME: 2.748M Avg Volume: 3.774M
BUY POINT:$98.11 Volume=5M Target=$108.61 Stop=$94.61
POSITION: EA AUG 16 2019 100.00C — (47 delta) &/or Stock
Save $600 per year and enjoy a 2 week trial of our IH Alerts Service!
Chart by StockCharts.com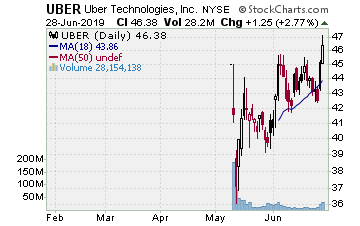
4) SUCCESS TRADING GROUP
— by the MarketFN STG Team
NASDAQ:UBER (UBER)
Company Profile
Our Success Trading Group members scored another winning trade this week when we closed out a position in Uber (NASDAQ:UBER). We are watching other several stocks and are looking forward to trading next week.
Our Success Trading Group closed seven years with zero losses on our Main Trade Table. In fact, we closed 100% winning trades for the calendar years 2016, 2015, 2013, 2012, 2011, 2010 and 2009. We still have one open position from 2017 (all others were winners) and one trade that we opened in 2014 but was closed as a losing trade.
All of these trades are posted on our Main Trade Table for your review during your free membership trial period.
Get Our Next Trade Free – Save $50 per month! Details Here.
Chart by StockCharts.com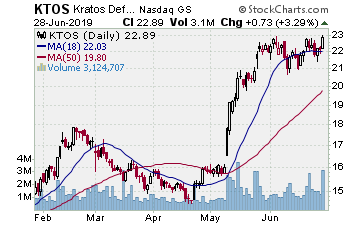
5) COVERED CALL PLAY
NASDAQ:KTOS — Kratos is currently trading at $22.16. The August $22.50 Calls (KTOS20190817C00022500) are trading at $1.35. That provides a return of about 7% if KTOS is above $22.50 by the time of the expiration.
Learn more about our Covered Call Tables
PREMIUM SERVICES
IH Alerts: InvestmentHouse.com’s Best of The Best Plays!
Stock Split Report: Forbes.com Best of the Web
Covered Calls: Allowed in your IRA – Energize your portfolio!
The Daily: “The Daily” is a must read for all investors!
Success Trading Group: 7 years without a trading loss!
The foregoing is commentary for informational purposes only. All statements and expressions are the opinions of Online Investment Services, LP., or Split Ventures, Ltd. This information is not meant to be a solicitation or recommendation to buy, sell, or hold securities. We are not licensed or registered in the securities industry. The information presented herein and on the related web site has been obtained from sources believed to be reliable, but its accuracy is not guaranteed. The security portfolios of writers for this issue may, in some instances, include securities mentioned herein and on the related web site. Estimates, assumptions and other forward-looking information are subject to the limits of forecasting. Actual future developments may differ materially due to many factors. No one associated herewith receives compensation in any manner from any of the companies that are discussed in this newsletter or on the related websites.
