Weekend Issue for 7/14

THE WEEKEND ISSUE
Informing Investors Around The World
Read In All 50 States And Over 100 Countries
Weekend Newsletter for
July 14, 2019
Table Of Contents
1) MARKET SUMMARY from THE DAILY
2) STOCK SPLIT REPORT
3) IH ALERTS
4) SUCCESS TRADING GROUP
5) COVERED CALL SERVICE

1) MARKET SUMMARY
> > Excerpted from Thursday’s paid content of “The Daily” by Jon Johnson at InvestmentHouse.com. To get his latest information and his daily content, click here now to receive a two-week trial and save $30/month. (You won’t find this offer on the Investment House website. It is exclusively for The Weekender subscribers!)
The Fed Chairman Spoke and the Markets Responded.
Powell uttered the inanity of the current economic theory that is truly just a theory.
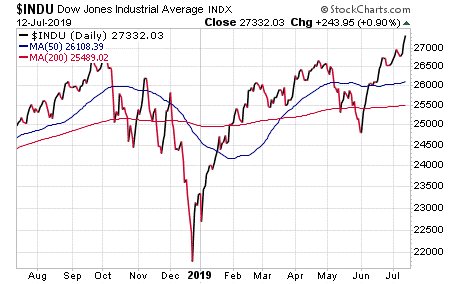
The DJ30 and the S&P500 moved to new all-time highs while the NASDAQ faded back.
While the good old rotation is not bad, it remains to be seen if it will it spread out to include the small and mid-cap stocks.
While it appeares that the yield curve has almost been healed, it is really only almost no longer inverted. That does not mean healed.
Market Summary (continued from above)
On Thursday, Chairman Powell told Congress that low unemployment leads to wage increases which then leads to inflation. However, this is really only true in the theoretical world of the “academics” (credit to Art Laffer again) who populate the Federal Reserve. While this is also the theory that is taught in the nation’s leading universities, it is just a theory. In reality, the relationship between those three elements is not what leads to inflation. Rather, the focal problem is the controls that are placed upon businesses such as taxes and regulations. These restrictions prevent buisnesses from producing what is needed. In an environment where supply is pinched off artificially, prices will inevitably rise as the same amount, or more, money is chasing a limited supply of goods.
When the controls are removed, or even loosened, and the supply can reach its potential, you can have low unemployment, high wages and no inflation. For example, the 1970s saw double-digit interest rates and double-digit inflation, wage controls, price controls, WIN buttons, very low levels of growth, unemployment, high taxes, and the ceaseless implementation of lots of regulations. Then, President Reagan came in, slashed taxes, slashed regulation and the economy boomed. Yes, the United States spent all the tax revenue on defense in order to drive the Soviet Union into collapse. However, it worked until President George H. W. Bush almost blew it all with his absurd economic policies (such as his famous “no new taxes, except the new ones I caved on”). Then, President Clinton caught the rebound from the downturn and had enough sense to not get in its way, at least partly, when he cut capital gains taxes even as other taxes were increased. Remember when he said that, “the era of big government is over?” You surely won’t hear any Democratic Party candidate say that today, but the economy sure continued to boom under Clinton. Again, there was jobs growth like in the Eighties, lots of people working, big wage increases and . . . no inflation.
Recent history has shown how these relationships work. History repeated itself again under the Obama administration’s huge amounts of new regulations and taxes that stymied small businesses, gave the big corporations the edge and caused the United States to lose businesses every year of his presidency, even when the United States was supposedly recovering from the Great Recession. Then taxes were cut, regulations slashed and economic growth began again. Unfortunately, a lot of damage was done as the economic downturn transferred huge amounts of money from the middle class to the 1% and the economy has never been able to get on track ever since. Even with the recent economic growth and supposedly low unemployment (even though 95 million people who are of working-age are still out of the workforce), inflation remains low. In fact, inflation is so low that the Fed is willing to cut rates during relatively good times to try and ignite some inflation. Talk about a bad idea! However, the world we live in today is a long, long way from the Great Depression years and the 1970s. These periods were truly bad and changed the behavior of people for almost a century afterwards.
DJ30: The DJ30 finally pushed through its old high from October 2018. It then had a clean break and closed near its new high with a rising volume.
S&P 400: The S&P 400 tapped its 20-day exponential moving average (EMA) on the low and rebounded. However, it still closed lower at the end of Wednesday’s trading session. While this is not a bad flag pattern, “not bad patterns” have to turn into very good breakouts.
NASDAQ: While it gapped to the upside, it came short of a new high. It then faded and closed at a modest loss. Since its volume moved above the Wednesday average trade, this suggests that there might be a bit of churn in the form of higher volume selling.
SOX: SOX gapped modestly higher, showing a doji over the 10-day EMA. While this was not bad, it was not great either. Furthermroe, while the graph has shown lots of good patterns, those patterns need to show that they can move.
NOTE: The figures and information above are from the 7/11 report.
NOTE: The videos are from the 7/10 report.
Here are two trades from “The Daily” and insights into our trading strategy:
Chart by StockCharts.com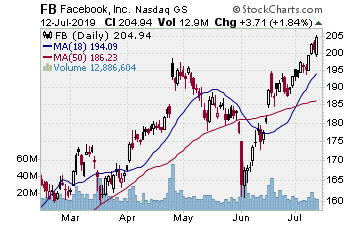
FB (NASDAQ: Facebook)
Company Profile
We moved into FB on 6/20 when it rebounded from a test of its rally off of the early June flop to the 200-day simple moving average (SMA). While we tried to get it earlier, FB was gapping higher on multiple days. Thus, we had to wait for the test.
So, when FB rebounded, we moved in with some August $187.50 strike call options for $10.50. Then, FB rallied for a couple of sessions and then tested to the 10-day EMA on 6/25. That was the test of the new break upside and the 10-day hold.
From there, FB rallied up the 10-day EMA. While this pattern was neither spectacular nor breathtaking, it was steady. Recently, FB jumped off the 10-day EMA and hit our initial target on 7/10. We then sold half of our position for $17.30, banking almost 65%.
CI (NYSE: Cigna Corp.)
Company Profile
Chart by StockCharts.com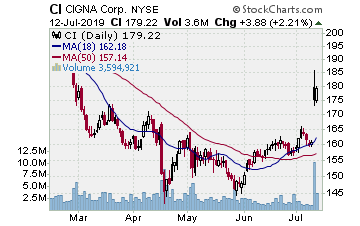
CI broke higher on 7/3, the day before the Independence Day holiday. This was the move we were looking for. Indeed, this was an option play, given that the move was to the 200-day SMA resistance. Thus, we bought the September $165.00 strike call options at $5.65 when the stock was at $164.05.
CI promptly faded, but did not break. Instead, it just tested the move up off the 50-day EMA. It held that support through Wednesday and Thursday before gapping higher on the news that the president was not pursuing legislation to curb drug prices. Since then, CI gapped upside, moved through the 200-day SMA and started to stall.
Since that was our target, we went ahead and sold the calls for $17.10. We thus banked over 200%.
Receive a 2 week trial and if you stay on receive a $30 per month discount!
2) STOCK SPLIT REPORT
Here’s a leader play and our current analysis.
Chart by StockCharts.com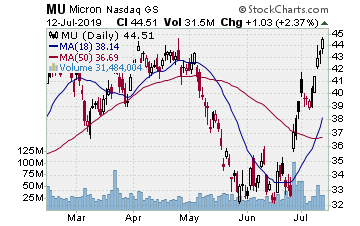
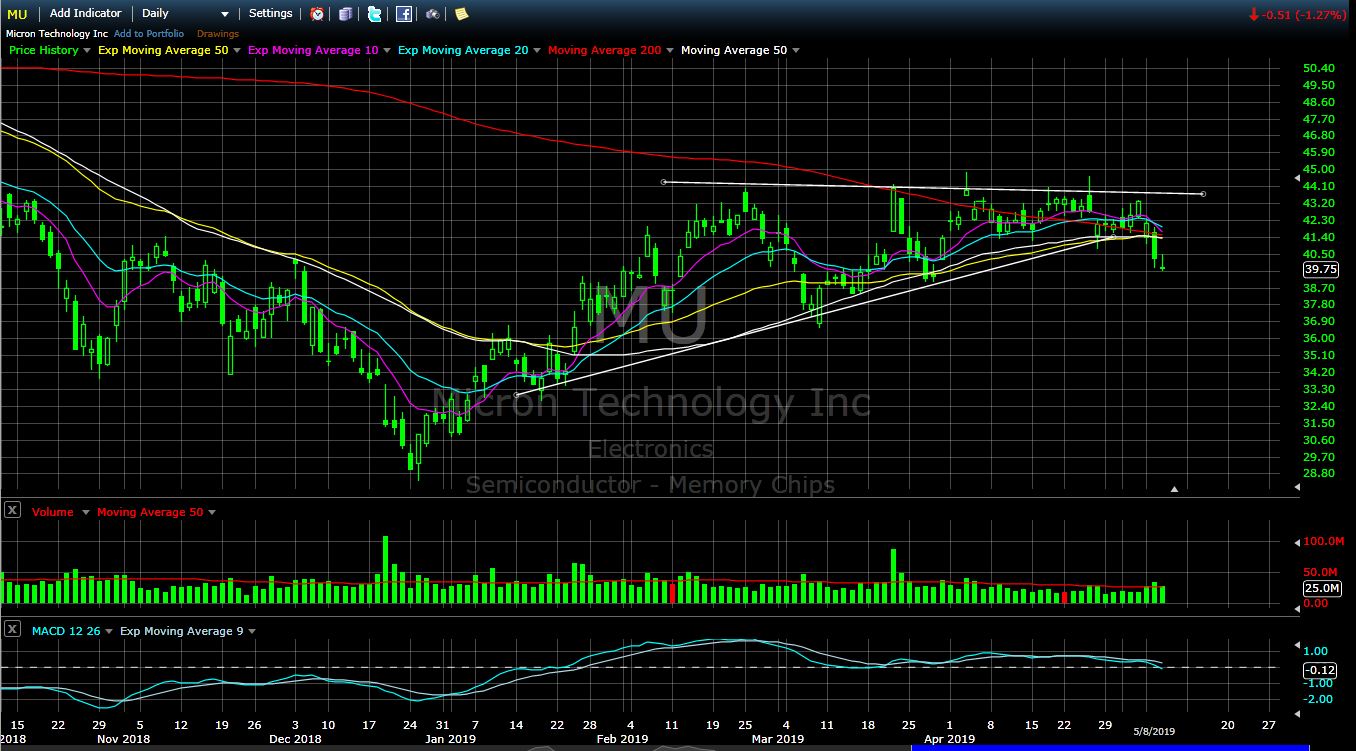
NASDAQ:MU MU (Micron Technology–$40.41; +0.98; optionable)
EARNINGS:09/24/2019
STATUS: MU is working its way off a downtrend from early 2018. After the December bottom, MU’s share price made it to the 200-day SMA in April. However, it could not surpass it. While the share price then fell off, it put in a higher low in June. Then, it rebounded by forming a short cup when it cleared the 200-day SMA at the begining of July. MU actually put in a test that formed a handle last week, holding on to its 200-day SMA. On Monday, MU broke higher on a solid volume shot. This was a nice action, and we want to move in as it continues. A rally to the target will gain around 9% on the stock and around 60% on the options.
VOLUME: 28.007M Avg Volume: 30.072M
BUY POINT: $40.63 Volume=28M Target=$44.24 Stop=$39.43
POSITION: MU SEP 20 2019 40.00C – (57 delta) &/or Stock
Learn more about our Stock Split Report and how we have made gains of 321% with our powerful stock split plays!
Save $360 per year on the Stock Split Report! Plus 2 week trial!
Chart by StockCharts.com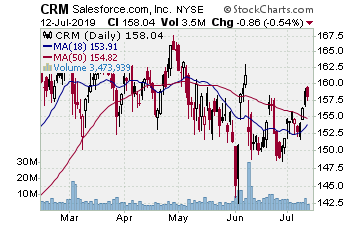
3) IH ALERTS
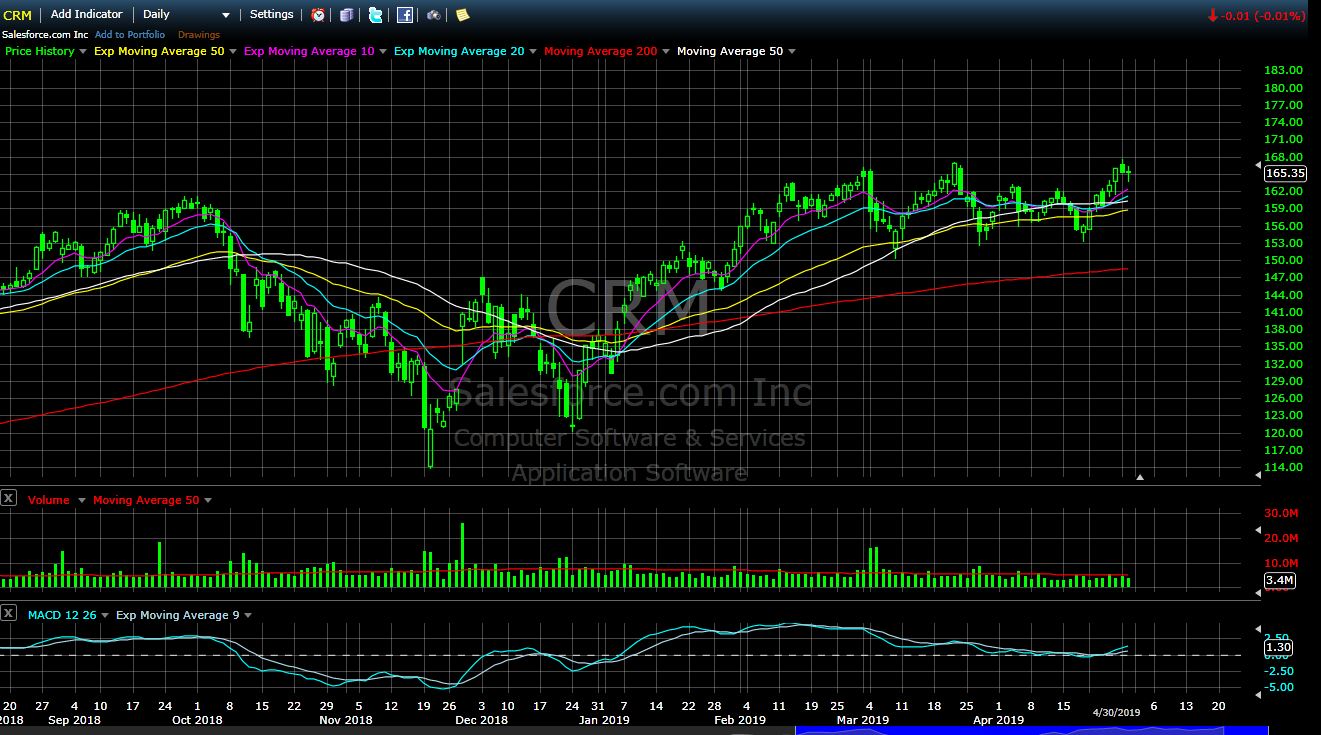
NYSE:CRM CRM (Salesforce.com–$156.27; +2.32; optionable)
Company Profile
EARNINGS: 09/03/2019
STATUS: CRM has churned through a flattish base since February. Since May, CRM has faded toward the 200-day SMA and has since worked laterally over that level. In early June, it was only below the 200-day SMA for one session before it shot back up. Since then, it has continued along its lateral range, putting in a higher low this week and jumping through the 50-day MA on Wednesday. As the stock still looks solid, we want to step in when there is a run at the prior range high that CRM achieved in early 2019. That move would give us around 55% on the call options.
VOLUME: 4.821M Avg Volume: 7.093M
BUY POINT: $156.44 Volume=6.2M Target=$165.49 Stop=$153.48
POSITION: CRM SEP 20 2019 155.00 C – (54 delta)
Save $600 per year and enjoy a two week trial of our IH Alerts Service!
Chart by StockCharts.com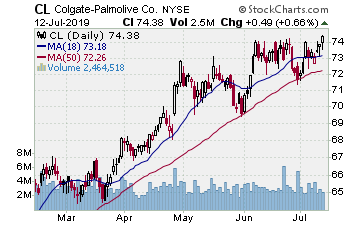
4) SUCCESS TRADING GROUP
— by the MarketFN STG Team
NYSE:CL (Colgate-Palmolive Company)
Company Profile
Our Success Trading Group members scored another winning trade this week when we closed out a position in Colgate-Palmolive Company (NYSE:CL). We are watching other several stocks and are looking forward to trading next week.
Our Success Trading Group closed seven years with zero losses on our Main Trade Table. In fact, we closed 100% winning trades for the calendar years 2016, 2015, 2013, 2012, 2011, 2010 and 2009. We still have one open position from 2017 (all others were winners) and one trade that we opened in 2014 but was closed as a losing trade.
All of these trades are posted on our Main Trade Table for your review during your free membership trial period.
Get Our Next Trade Free – Save $50 per month! Details Here.
Chart by StockCharts.com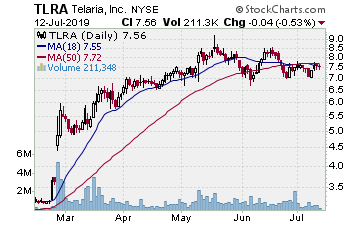
5) COVERED CALL PLAY
NYSE:TLRA — Telaria, Inc. is currently trading at $7.60. The August $7.50 Calls (TLRA20190817C00007500) are trading at $0.50. That provides a return of about 9% if TLRA is above $7.50 by the time of the expiration.
Learn more about our Covered Call Tables
PREMIUM SERVICES
IH Alerts: InvestmentHouse.com’s Best of The Best Plays!
Stock Split Report: Forbes.com Best of the Web
Covered Calls: Allowed in your IRA – Energize your portfolio!
The Daily: “The Daily” is a must read for all investors!
Success Trading Group: 7 years without a trading loss!
The foregoing is commentary for informational purposes only. All statements and expressions are the opinions of Online Investment Services, LP., or Split Ventures, Ltd. This information is not meant to be a solicitation or recommendation to buy, sell, or hold securities. We are not licensed or registered in the securities industry. The information presented herein and on the related web site has been obtained from sources believed to be reliable, but its accuracy is not guaranteed. The security portfolios of writers for this issue may, in some instances, include securities mentioned herein and on the related web site. Estimates, assumptions and other forward-looking information are subject to the limits of forecasting. Actual future developments may differ materially due to many factors. No one associated herewith receives compensation in any manner from any of the companies that are discussed in this newsletter or on the related websites.
