Weekend Issue for 7/21

THE WEEKEND ISSUE
Informing Investors Around The World
Read In All 50 States And Over 100 Countries
Weekend Newsletter for
July 21, 2019
Table Of Contents
1) MARKET SUMMARY from THE DAILY
2) STOCK SPLIT REPORT
3) IH ALERTS
4) SUCCESS TRADING GROUP
5) COVERED CALL SERVICE

1) MARKET SUMMARY:
Excerpted from Thursday’s paid content of “The Daily” by Jon Johnson at InvestmentHouse.com. To get his latest information and his daily content, click here now to receive a two-week trial and save $30/month. (You won’t find this offer on the Investment House website. It is exclusively for The Weekender subscribers!)
Earnings Reporting Season Has Begun.
Due to disappointing earnings, stocks start low and then put in a low to high move.
The pullback may be ending as the chip stocks continue to lead the rest of the market.
Semiconductor stocks post some very good moves off some very good patterns.
The VanEck Vectors Semiconductor ETF (SMH) clears the “trade truce” high, an important milestone.
Market Summary (continued from above)
The economic outlook continues to be muddy.
At the same time, however, a trade deal with China appears remote, regardless of what JPMorgan Chase thinks. Indeed, after President Trumpâs comments on Wednesday about a deal being a long ways off, Treasury Secretary Mnuchin said that they were having a telephone conference on Thursday as âcomplicated issuesâ remain. These were the “uncertainties” that Fed Chairman Jerome Powell discussed in his congressional testimony.
The Fed had something to say as well. New York Fed President John Williams continued the Fed’s dovish bias by noting that it was better to take “preemptive measures” than suffer the consequences of waiting too long to act. He also discussed the virtues of ZIRP, that is, zero interest rate policy. Okay, that sounds dovish.
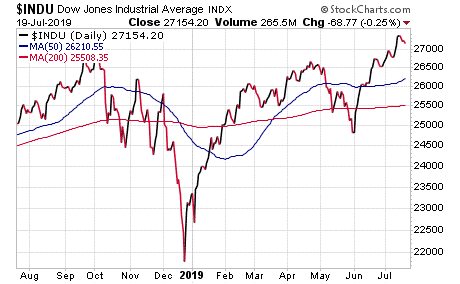
DJ30: The DJ30 had a nice doji and a tail test of the 10-day exponential moving average (EMA). Also, its break held over the prior highs even on the low. It also helped that there was a nice action in setting up a rebound as Boeing (BA) was up afterhours due to its management’s desire to compensate airlines that have suffered financially as a result of the recent 737 MAX crashes. Microsoft (MSFT) also moved up nicely afterhours due to its strong earnings.
S&P 400: The S&P 400 gapped lower, undercut the two-and-a-half week lateral range and then reversed to hold it. Perhaps this was the final shakeout of the weaker holders in the lateral consolidation. While the table is set, will any buyers come to eat?
NASDAQ: The NASDAQ gapped lower to the August 2018 high, tested it and then moved higher on a good shot of trading volume that was finally back above average. This course of events showed that buyers came in on the dip. Meanwhile, the up/down volume was significantly stronger as it tested the early July peak that is coincident with the April/May peaks. This was a good series of actions that were aided, of course, by the chip stocks.
SOX: The Philadelphia Semiconductor Index (SOX) broke higher to a new recovery high, even though it did not take out the high that it achieved during the “trade truce” on Monday. At the same time, there was also some good action amid the large-cap chips.
NOTE: The figures and information above are from the 7/18 report.
NOTE: The videos are from the 7/18 report.
Here are two trades from “The Daily” and insights into our trading strategy:
Chart by StockCharts.com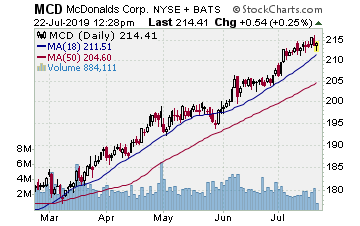
MCD (NYSE: McDonald’s Corp.)
Company Profile
We had some July call options left on MCD from a position that we entered in early June. Since the price of MCD shares was rising all of July, we decided to let the remaining half of the position continue to work as long as the upside pace was steady.
We bought the calls on 6/6 for $6.40 as MCD had rallied to $215 on the previous Thursday and then faded. This week, MCD rallied and, once again, found resistance at $215. On Tuesday, it hit that level yet again and then stalled.
That was it for us. Since the calls would expire this week, we sold the last of our MCD calls for $13.80 and banked 115%. Of course, MCD shares jumped to a new high on Thursday. Oh well.
AXP (NYSE: American Express Co.)
Company Profile
Chart by StockCharts.com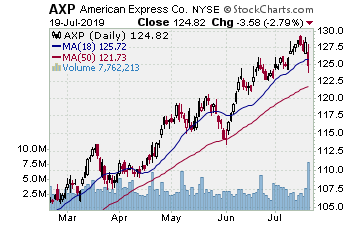
We like to play the credit services companies — credit card companies to be more precise — when they set up at the short-term moving averages in preparation for the next run. Last week, I discussed our most recent play on Visa (V) and we also entered a play on AXP. AXP reached a higher high in mid-June and then tested back to the 10-day EMA. Since AXP had just come off a 50-day EMA test, it likely has four to five rallies off the 10- or 20-day EMA before it tests deeper. In fact, we saw it start up off the 10-day EMA in early July. Thus, we were ready.
On July 3, we moved in with some options to play the bounce and bought some August $125.00 calls at $2.88. AXP held at the 10-day EMA for three sessions after we bought these calls and then it broke upside with a slow rise into this week. On Tuesday, its sixth upside session off the 10-day EMA test, AXP gapped to a higher high. Then, it started to back off.
That was about all the days it seemed like it would get on these moves, and with the indices looking as if they were going to test the last leg higher, it was time to bank the gains. We sold the calls for $4.00 and banked 38%. On Wednesday, AXP continued to test. On Thursday, it opened lower but recovered. While we may need to start a new play, we would prefer a bit more of a test.
Receive a two week trial and if you stay on receive a $30 per month discount!
2) STOCK SPLIT REPORT
Here’s a leader play and our current analysis.
Chart by StockCharts.com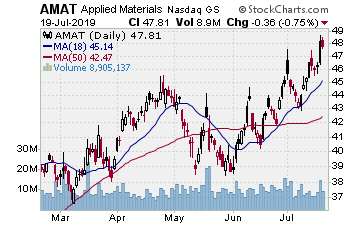
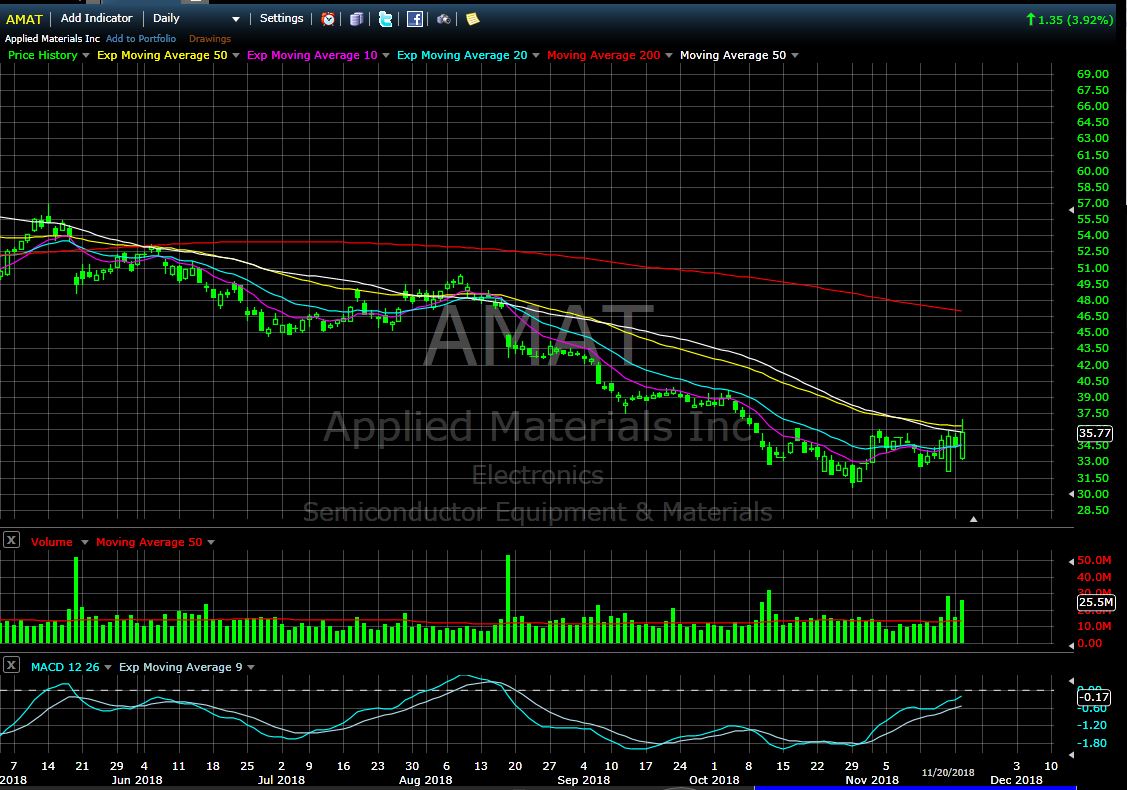
NASDAQ:AMAT (Applied Materials Inc. — $46.22; +0.21; optionable): Chip equipment
EARNINGS: 08/15/2019
STATUS: AMAT is in a big base from its March 2018 high. Over the past 13 months, its trajectory has formed a large inverted head and shoulders pattern. Then, over the last three months, AMAT formed the right shoulder by using the 200-day SMA as support. After a move higher over the past two weeks, AMAT is testing this week and holding over the 10-day EMA. If AMAT can make a break on some volume, we want to move in. A rally to the target will give us around 13% on the stock and around 120% on the options.
VOLUME: 8.347M Avg Volume: 9.527M
BUY POINT: $46.55 Volume=12M Target=$52.56 Stop=$44.723
POSITION: AMAT SEP 20 2019 46.00C — (54 delta) &/or Stock
Learn more about our Stock Split Report and how we have made gains of 321% with our powerful stock split plays!
Save $360 per year on the Stock Split Report! Plus a two week trial!
Chart by StockCharts.com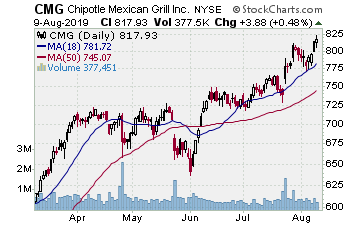
3) IH ALERTS
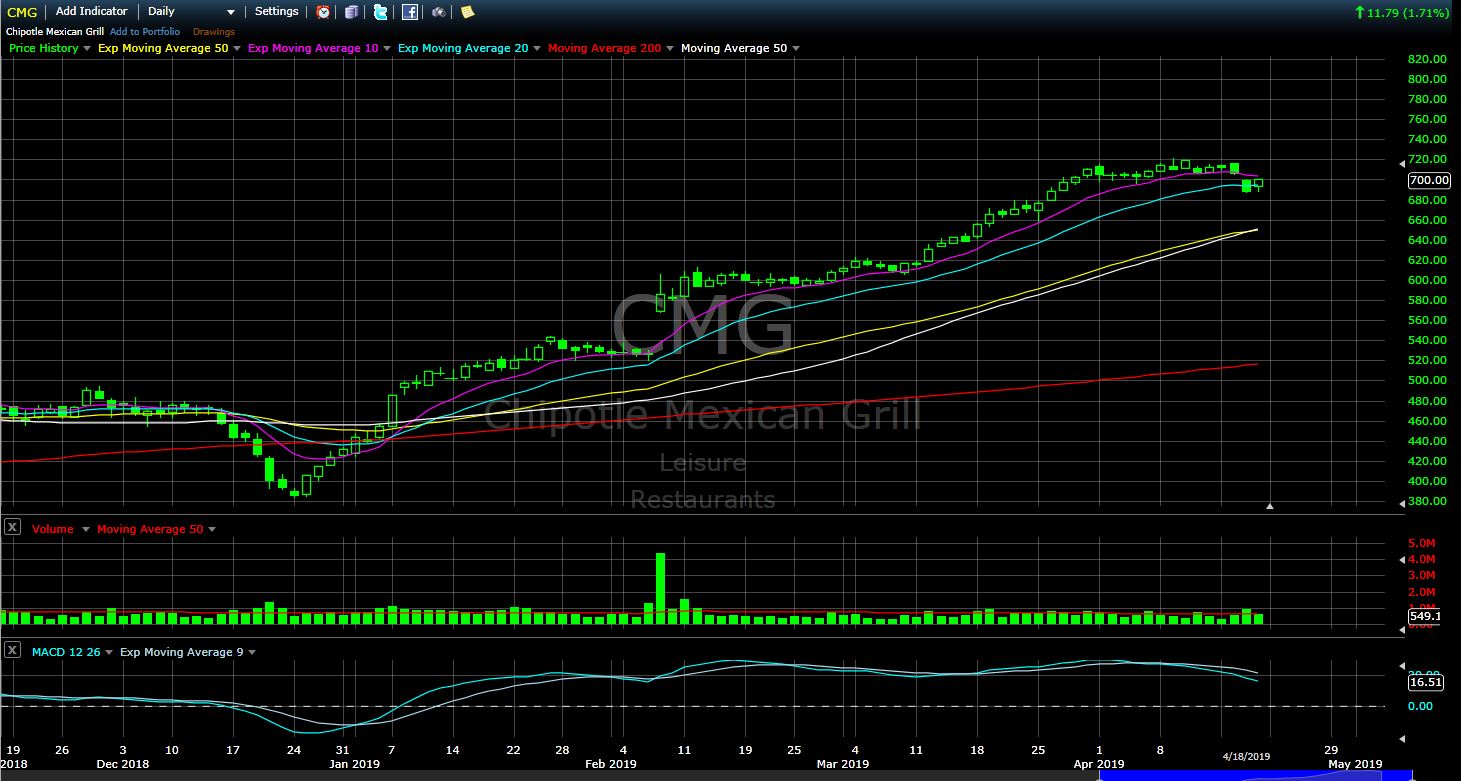
NYSE:CMG CMG (Chipotle Mexican Grill–$759.87; +9.01; optionable)
Company Profile
EARNINGS: 07/23/2019
STATUS: CMG is breaking higher from a five-week lateral consolidation. It began to show strong volume when it started stirring on Friday and then broke higher on Monday. As its earnings will be released next week, we want to play a rally towards the earnings and likely part of the position as well. A move to the initial target will give us around 60% on the options.
VOLUME: 461.818K Avg Volume: 449.289K
BUY POINT: $760.21 Volume=465K Target=$799.98 Stop=$746.93
POSITION: CMG AUG 16 2019 760.00C — (52 delta)
Save $600 per year and enjoy a two week trial of our IH Alerts Service!
Chart by StockCharts.com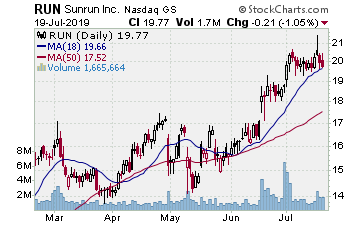
4) SUCCESS TRADING GROUP
— by the MarketFN STG Team
NASDAQ:RUN (Sunrun Inc.)
Company Profile
Our Success Trading Group members scored another winning trade this week when we closed out a position in Sunrun Inc. (NYSE:RUN). We are watching other several stocks and are looking forward to trading next week.
Our Success Trading Group closed seven years with zero losses on our Main Trade Table. In fact, we closed 100% winning trades for the calendar years 2016, 2015, 2013, 2012, 2011, 2010 and 2009. We still have one open position from 2017 (all others were winners) and one trade that we opened in 2014 but was closed as a losing trade.
All of these trades are posted on our Main Trade Table for your review during your free membership trial period.
Get Our Next Trade Free – Save $50 per month! Details Here.
Chart by StockCharts.com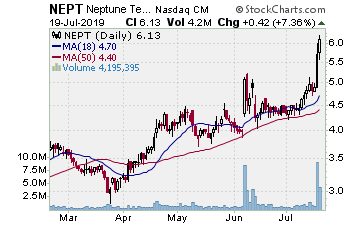
5) COVERED CALL PLAY
NASDAQ:NEPT — Neptune Technologies & Bioresources Inc. is currently trading at $5.17. The August 17 $6.00 Calls (NEPT20190817C00006000) are trading at $0.45. That provides a return of about 9% if NEPT is above $6.00 by the time of the expiration.
Learn more about our Covered Call Tables
PREMIUM SERVICES
IH Alerts: InvestmentHouse.com’s Best of The Best Plays!
Stock Split Report: Forbes.com Best of the Web
Covered Calls: Allowed in your IRA – Energize your portfolio!
The Daily: “The Daily” is a must read for all investors!
Success Trading Group: seven years without a trading loss!
The foregoing is commentary for informational purposes only. All statements and expressions are the opinions of Online Investment Services, LP., or Split Ventures, Ltd. This information is not meant to be a solicitation or recommendation to buy, sell, or hold securities. We are not licensed or registered in the securities industry. The information presented herein and on the related web site has been obtained from sources believed to be reliable, but its accuracy is not guaranteed. The security portfolios of writers for this issue may, in some instances, include securities mentioned herein and on the related web site. Estimates, assumptions and other forward-looking information are subject to the limits of forecasting. Actual future developments may differ materially due to many factors. No one associated herewith receives compensation in any manner from any of the companies that are discussed in this newsletter or on the related websites.
