Weekend Issue for 8/18

THE WEEKEND ISSUE
Informing Investors Around The World
Read In All 50 States And Over 100 Countries
Weekend Newsletter for
August 18, 2019
Table Of Contents
1) MARKET SUMMARY from THE DAILY
2) IH ALERTS
3) SUCCESS TRADING GROUP
4) COVERED CALL SERVICE


1) MARKET SUMMARY:
Excerpted from Thursday’s paid content of “The Daily” by Jon Johnson at InvestmentHouse.com. To get his latest information and his daily content, click here now to receive a two-week trial and save $30/month. (You won’t find this offer on the Investment House website. It is exclusively for The Weekender subscribers!)
Yield Curve Inversion Shakes Up Markets.
Stocks got a trade talk save, rallied and then sold. It bears noting that a stick save is not an offensive play.
There has not been a huge response to the “warming” trade talk, but the S&P 500 and the NASDAQ have been able to hold their support and rebound.
Although the expiration for many calls was on Friday, many of the large caps looked as if they could bounce to end the week. However, this didnât answer the “base or top?” question on Friday.
Market Summary (continued from above)
Stocks looked as if they would open lower yet again as of 6:30 Eastern Time (ET) on Thursday. This was because China had come out after 4:00 p.m. ET and blustered that tariff delays were not enough to stop it from retaliating. Stocks were sold. 90 minutes later, a statement was issued that was purportedly from President Xi where he “hoped” that the United States would âmeet China half wayâ with regards to something. I take that to mean the United States has already delayed imposing new tariffs on some goods and should just eliminate the new tariffs altogether. All of this would be one-sided for China. If I were Presidnet Trump, I would have responded that halfway would mean that China would start to buy the agricultural products it promised to at the “trade truce” several weeks back. However, all of this is simple semantics, right?
Judging by the advance in stocks, you would think a deal was just 10% away once again. In reality, as has been stated so many times, China totally reneged and walked away. Meanwhile, stocks rallied to the open, opened higher and then the entire remaining session was a case of back and forth and give and take. Then, there was an early afternoon selloff that looked a bit spooky. In the end, a rebound to the top of the range in the second half of the afternoon closed things respectably, even if the results were a bit mixed.
We had wanted a continued selloff to really heat up the downside and test those interim lows. Unfortunately, this didnât happen. Instead, the morning news was enough to act as a pressure release valve and a lot of the fear and paranoia abated. We’ll have to wait for another chance to really sell things off and work on cleaning the pipes for a better rebound rally.
S&P 500/NASDAQ: Both the S&P 500 and the NASDAQ held over the prior week’s lows on Thursdayâs intraday weakness and rebounded nicely to close. That indicates either the presence of buyers or a dissipation of selling at those levels. That scenario will leave them open for a rebound yet again after a sharp drop.
DJ30: The DJ30 got close to 25,250 (as it reached 25,339) and then rebounded. At one point, it was back over the 200-day simple moving average (SMA) that it gave up on Wednesday, but it could not stay there. Still, it held near that level as we birddogged a potential bounce point and could join the S&P 500 and the NASDAQ in trying to push upside on Friday.
NOTE: The figures and information above are from the 8/15 report.
NOTE: The videos are from the 8/15 report.
Here are two trades from “The Daily,” offering insights into our trading strategy and the targets that we have hit this week:
Chart by StockCharts.com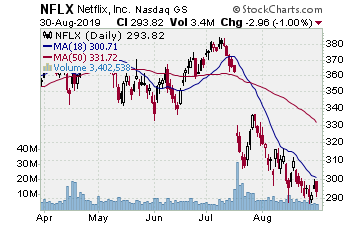
NFLX (NASDAQ: Netflix)
Company Profile
NFLX has already put in a nasty leg lower with the mid-July earnings gap that allowed it to break away down out of the seven-month trading range. NFLX rallied up to the 200-day SMA two weeks back and then rolled over. We entered that move with a downside position and banked a gain late last week when NFLX showed a doji after a cruise lower.
NFLX then jumped to the 10-day exponential moving average (EMA) on Thursday. On Friday, it rolled to the negative after trying to move through the 10-day EMA. We think NFLX is setting up a trend just below the 10-day EMA just as a breakout to the upside will set up a trend just above the 10-day EMA. Thus, we want to play further NFLX weakness to the downside. There are upside gaps from early January and those are the ones that are next in line to be filled as NFLX continues to sell. A move to the initial target will give us a 60% gain on the October puts and around a 95% gain on the September puts. It just depends on what your risk tolerance is. Again, this looks to be setting up an entrenched downtrend. Thus, we want to play the heck out of it as it continues.
DIS (NYSE: Disney)
Company Profile
Chart by StockCharts.com
Bear flag. We have a current upside play on DIS that did not help us out on the earnings as it had in April. Instead of moving up, DIS gapped lower on Wednesday due to those results and reversed a nice Tuesday jump off the 50-day moving average (MA). As of Friday, DIS tapped the 50-day EMA on its session high and backed off a bit from there to close. Its volume was lower as it moved back to its average and did not indicate that much participation in this upside move.
There is a massive upside gap from April. If the market stalls out and sells off, that gap is fully in play for a fill. Our initial target, however, is the upper gap point. That move will give us around an 80% gain on the put options. We also need to see DIS fail the rebound move, break lower through the buy point and hold the move. Now, if the market gets clobbered as a result of whatever stories are leading it around by the nose yet again, we can go ahead and take some positions without waiting for the last hour of trading.
We want to move in as it continues upward in order to capture what we can. A rally to the target will give us a gain of 10% on the stock and 55% on the options.
Targets Hit This Week:
Ulta Beauty Inc. (NASDAQ:ULTA): Some parts of the market are still holding up and rising, but many parts, including leaders, are struggling after good moves. ULTA is currently in a five-month range, so when it crashed the 50-day MA to start the month of August and rebounded to test, it looked ripe to trade a move to the downside in order to try the May low or the lower gap point from an upside gap in March. We put ULTA on the report on 8/12 as it broke back through the 50-day MA after testing from below and breaking over it for one session. During the next session, ULTA tried to rally due to that market volatility, but after kissing the 50-day SMA on the high, it started to backtrack. That was perfect as it was the time to enter. The September $335.00 strike puts were priced at $15.95 and showed a 55% delta.
The stock managed to hold a gain for the session but was way off the high by the time that the market closed. As anticipated, the market volatility remained and ULTA gapped lower on Wednesday and sold hard towards the target near the 200-day SMA. After lots of downside momentum, it was best to let it ride for the next session. ULTA started lower on Thursday and undercut the 200 day SMA. This was good, but we had to watch for the reversal near the support levels it was now touching. Sure enough, ULTA started back upside after that break. It was time to sell. The options were worth $24.60 and produced a solid 60% take on the trade to capture the test of the lower support.
Receive a two week trial and if you stay on receive a $30 per month discount!
Chart by StockCharts.com
2) IH ALERTS
NASDAQ:MTCH (Match Group–$85.63; -1.54; optionable)
Company Profile
EARNINGS: 11/05/2019
STATUS: We certainly liked how MTCH looked heading into earnings with its 12-week range long the 50-day MA. Given the fact that earnings have resulted in feast or famine, we opted to wait and let MTCH show the move, and if possible, counterpunch with plays off of that move. MTCH jumped off the 50-day MA on the earnings on Wednesday and then spent Thursday and Friday testing. On Friday, MTCH reached near the rising 10-day EMA on the low and then rebounded to a rather modest loss. It may want to come back again and fully test the 10 day. After all, stocks that breakout, such as MTCH, often put in a one-two-three test, meaning they test for three sessions and likely show a doji with a tail (typically the 10-day EMA). If that happens, perfect. At times, however, a stock will surge right up off of this setup, so we want to be ready to move in if MTCH moves higher from here. A move to the target will give us around a 15% gain on the stock and a 75% gain on the options.
VOLUME: 3.286M Avg Volume: 2.221M
BUY POINT: $87.31 Volume=3.4M Target=$99.98 Stop=$83.08
POSITION: MTCH DEC 20 2019 90.00C — (49 delta) &/or Stock
Save $600 per year and enjoy a two week trial of our IH Alerts Service!
Chart by StockCharts.com
3) SUCCESS TRADING GROUP
— by the MarketFN STG Team
NYSE:SNAP (Snap Inc.)
Company Profile
Our Success Trading Group members scored another winning trade when we closed out a position in Snap Inc. (NYSE:SNAP). We are watching several other stocks and are looking forward to trading next week.
Our Success Trading Group closed seven years with zero losses on our Main Trade Table. In fact, we closed 100% winning trades for the calendar years 2016, 2015, 2013, 2012, 2011, 2010 and 2009. We still have one open position from 2017 (all others were winners) and one trade that we opened in 2014 but was closed as a losing trade.
All of these trades are posted on our Main Trade Table for your review during your free membership trial period.
Get Our Next Trade Free – Save $50 per month! Details Here.
Chart by StockCharts.com
4) COVERED CALL PLAY
NASDAQ:ATNX — Athenex, Inc. is currently trading at $14.82. The October 19 $15.00 Calls (ATNX20191019C00015000) are trading at $1.25. That provides a return of about 13% if ATNX is above $15.00 by the time of the expiration.
Learn more about our Covered Call Tables
PREMIUM SERVICES
IH Alerts: InvestmentHouse.com’s Best of The Best Plays!
Stock Split Report: Forbes.com Best of the Web
Covered Calls: Allowed in your IRA – Energize your portfolio!
The Daily: “The Daily” is a must read for all investors!
Success Trading Group: seven years without a trading loss!
The foregoing is commentary for informational purposes only. All statements and expressions are the opinions of Online Investment Services, LP., or Split Ventures, Ltd. This information is not meant to be a solicitation or recommendation to buy, sell, or hold securities. We are not licensed or registered in the securities industry. The information presented herein and on the related web site has been obtained from sources believed to be reliable, but its accuracy is not guaranteed. The security portfolios of writers for this issue may, in some instances, include securities mentioned herein and on the related web site. Estimates, assumptions and other forward-looking information are subject to the limits of forecasting. Actual future developments may differ materially due to many factors. No one associated herewith receives compensation in any manner from any of the companies that are discussed in this newsletter or on the related websites.
