Weekend Issue for 9/15

|
||
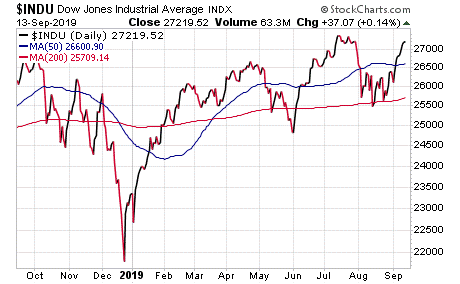
1) MARKET SUMMARY: Inflation Returns.
|
||
|
The trade news on Wednesday did provide some upside impetus, but not the In other words, it was not a powerful surge. As noted, the indicies gapped upside, rallied and Not only did President Trump’s comments about forestalling higher tariffs on S&P500: It gapped to a tight doji and came within eight points of the all-time high, experienced a solid volume and then moved up a bit more. While there may have been some churn, there is nothing nefarious about this NASDAQ: It gapped over the April 2019 and August 2018 highs. Then, it moved into the July NOTE: The figures and information above are from the 9/11 report. NOTE: The videos are from the 9/10 report. Here are some trades from “The Daily,” offering insights into our trading strategy and the targets that we have hit this week: Targets Hit This Week: With the nice surge from the bottom of the trading range to the verge of new highs, of course it was a week to bank gain – upside AND downside. Upside: Carbo Ceramics Inc.(NYSE:CRR): We saw CRR setting up at the 50-day moving average (MA) last weekend and starting a break higher on some good volume. We then decided to put it on the report as the oil and gas sector has formed up well for at least some short rallies. On Monday, CRR hit the entry point with a solid move and we picked up the stock for $1.87. This proved to be a good, clean pick as CRR surged into Thursday and rallied to test the 200-day simple moving average (SMA). That rang the bell on our target, and as CRR was just below the 200-day SMA with a doji, we sold the position for $2.66 and banked a gain of 42%. Now, we will have to see if CRR will form up a good pattern at the 200-day SMA. Nordstrom, Inc.(NYSE:JWN) : While several market leaders in the retail sector have hit new highs, other areas of retail have “turned the corner” after long declines. Now, they are breaking downward trends and posting excellent moves. We always watch for these stocks as the returns can be significant in a short period of time. We saw JWN over the weekend and put it on the report. On Monday, JWN continued its break over the 50-day MA and we bought some stock at $31.86 and some October $30.00 call options for $2.80. The momentum on the turn from the lows — and a nifty little inverted head and shoulders — was strong. Then, JWN ran right up to near our target by Thursday. It was showing a doji, and after a seven-session move higher, that was a good signal to bank some gains. So, we sold some stock for $34.64 and an 8.71% gain. We also sold part of the options for $5.00 and banked a 78% gain. Nvidia Corporation (NASDAQ:NVDA): We watched NVDA form a long six-month triangle base and waited for an entry. In late August, it put in a higher low at the 200-day SMA inside the pattern. We always watch for that because a higher low at such support typically leads to a breakout move from the pattern. So, when NVDA broke higher off the 200-day SMA on 8/29, we moved in with some October $165.00 call options for $10.55. While NVDA moved higher, it then tested once more in the base and experienced a short dip to the 50-day MA. From there it shot higher and broke out from the pattern two Thursdays ago. NVDA then walked higher into Thursday, gapped upside and brushed our target. We sold some options for $22.05 and banked 110%. Texas Instruments Inc. (NASDAQ: TXN): TXN broke higher from a two-month triangle on 9/5, but could not move forward. It tested into Tuesday and then came back to test the trendline and the 10-day exponential moving average (EMA). We saw that move and recognized it as a great entry for a continued breakout move — chips were strong and we assumed that TXN would follow higher. As a result, we picked up some October $125.00 call options for $4.85. Then, TXN made a quick move higher into Thursday. While it still looked strong, many chips were stalling after good moves. So, we banked half the options for $6.95 and took a 43% gain in less than three sessions. If this pattern continues, we still have half the position to carry us forward. Urban Outfitters, Inc. (NASDAQ:URBN): This is another one of those retailers that trended lower before finally turning the corner so that it could be ready to rally. We saw URBN break the 50-day MA a week earlier before it then faded to the test. After it showed a nice tight doji last Wednesday, we put it on the report. On 9/5, URBN surged off the test and we moved in with some stock at $24.71 and some October $23.00 call options for $2.40. URBN made one test during the next session and then it was all upside into Thursday. After the stock showed a doji on Thursday after the strong move, it was time to bank some gains. As a result, we sold some stock for $26.51 and a 7.2% gain. We also sold half the options for $3.70 and banked 54%. Downside: Arena Pharmaceuticals, Inc. (NASDAQ: ARNA): ARNA crashed the 50-day MA in early August after a steady rally up the 20-day MA. We then watched it recover and then stall when it got back to the 50-day MA. We put it on the report when it started to stall. Two sessions later, RNA broke lower and failed in its recovery attempt. Then, we moved in with some October $55.00 put options for $4.60. It was a slow process, but ARNA steadily sold below the 10-day EMA into Tuesday. This was when it hit the 200-day SMA and held. Since this was our target, we sold the options for $6.50 and a 40% gain. American Express Company (NYSE: AXP) : AXP was an exhausting downside play. We entered as it reversed an upside move, breaking below the 50-day MA the day after it jumped off that support. We entered with some September $120.00 puts for $2.46 on 8/14. That was the start of the volatile odyssey as AXP initally sold and then reversed again back over the 50-day MA. It then gapped lower below the 50-day MA during the next session. Then, it dove lower during the last half of August and then bounced back and forth below the 20-day EMA for over two weeks, constantly and slowly trending ever lower. Finally on Tuesday, AXP gapped and sold back to the prior lows. When it held at this position, we sold the puts for $3.30 and banked a 34% gain that was barely worth the amount of time we spent watching this play. Verisign, Inc. (NASDAQ:VRSN) : VRSN made us so much money on its incredible long run upward. When it broke the 50-day MA in early August, we saw the stock’s character change. Thus, we flipped our attention to using VRSN to make us money on the downside. It tested the move with a bear flag that stalled at the 50-day MA. We put it on the report and it gapped down from the 50-day MA on 8/12. At this point, we entered with some October $210.00 put options for $10.80. VRSN immediately rebounded to test the 50-day MA again. From there, it gapped to a lower low — ah the volatility — and having a spread to churn on it would have been great. VRSN then bounced up and down — always below the 50-day MA — for the next three weeks. This week, VRSN finally gave up after wearing itself out. It tumbled on Monday, Tuesday and Wednesday and finally hit our target when the markets closed on Wednesday. Since we saw a support in the form of the rising 200-day MA, we sold the position for $18.85 and a gain of 74%. Receive a two week trial and if you stay on receive a $30 per month discount! |
||
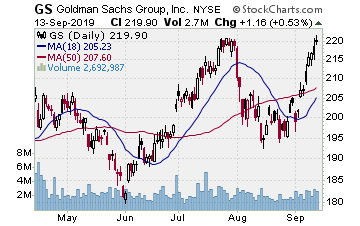
2) IH ALERTS NYSE:GS (Goldman Sachs–$207.21; +0.15; optionable) EARNINGS: 10/15/2019 STATUS: Goldman showed a doji on Friday after a nice Thursday gap higher through the 50-day EMA and up to the 50-day SMA. VOLUME: 1.439M Avg Volume: 2.073M BUY POINT: $208.28 Volume=3.1M Target=$218.31 Stop=$204.92 POSITION: GS OCT 18 2019 210.00C – (45 delta) &/or Stock Save $600 per year and enjoy a two week trial of our IH Alerts Service! |
||
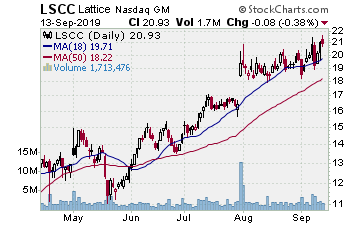
3) SUCCESS TRADING GROUP NASDAQ:LSCC (Lattice Semiconductor Corp.) Our Success Trading Group members scored another winning trade when we closed out a position in Lattice Semiconductor Corp. (NASDAQ: LSCC). We are watching several other stocks and are looking forward to trading next week. Our Success Trading Group closed seven years with zero losses on our Main Trade Table. In fact, we closed 100% winning trades for the calendar years 2016, 2015, 2013, 2012, 2011, 2010 and 2009. We still have one open position from 2017 (all others were winners) and one trade that we opened in 2014 but was closed as a losing trade. All of these trades are posted on our Main Trade Table for your review during your free membership trial period. |
||
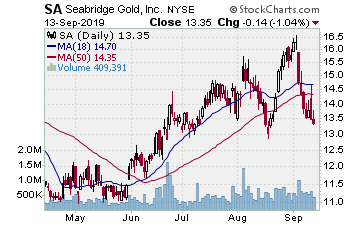
4) COVERED CALL PLAY Seabridge Gold Inc. (NYSE:SA) — Seabridge Gold Inc. is currently trading at $13.49. The November 16 $13.00 Calls (SA20191116C00013000) are trading at $1.25. That provides a return of about 10% if SA is above $13.00 by the time of the expiration. |
||
|
||
|
The foregoing is commentary for informational purposes only. All statements and expressions are the opinions of Online Investment Services, LP., or Split Ventures, Ltd. This information is not meant to be a solicitation or recommendation to buy, sell, or hold securities. We are not licensed or registered in the securities industry. The information presented herein and on the related web site has been obtained from sources believed to be reliable, but its accuracy is not guaranteed. The security portfolios of writers for this issue may, in some instances, include securities mentioned herein and on the related web site. Estimates, assumptions and other forward-looking information are subject to the limits of forecasting. Actual future developments may differ materially due to many factors. No one associated herewith receives compensation in any manner from any of the companies that are discussed in this newsletter or on the related websites.
|
||
|
|

