Weekend Newsletter for June 16, 2019

THE WEEKEND ISSUE
Informing Investors Around The World
Read In All 50 States And Over 100 Countries
Weekend Newsletter for
June 14, 2019
Table Of Contents
1) MARKET SUMMARY from THE DAILY
2) STOCK SPLIT REPORT
3) IH ALERTS
4) SUCCESS TRADING GROUP
5) COVERED CALL SERVICE

1) MARKET SUMMARY
> >From “The Daily” by Jon Johnson at InvestmentHouse.com
Stocks reviving after trade-related turmoil.
Stocks sold for a second session but it certainly was not the selling that Tuesday appeared to foretell.
The selling mostly died out as the indices held at near support.
Some good looking patterns remain as the ugly Tuesday action was not so ugly on Wednesday.
The impressive top remains, but stocks are not succumbing just yet.
Consumer prices have softened, leaving Powell’s dilemma in place. The market likes Powell having to struggle with his previous words.
Market Summary (continued)
The action on Wednesday certainly makes it appear that any pullback is going to be something less than the December low, at least on this round. Over the weekend and early last week, I talked about a smaller pullback bringing the SP500 to 2800.
After Wednesday’s action and the second “down” session in the pullback, I am inclined to adjust the pullback to an even shallower level such as the 50-day SMA, where it held on the Wednesday low. The SP500 traded in a tight range all session, holding support without any issues. Stocks that struggled mightily on Tuesday such as WDAY and PCTY managed — in some cases — to even out the keel. While we are not out of the woods, the market has demonstrated better actions.
The other indices are similar, though not as clear, as the SP500.
DJ30 — 50 day SMA on a tight range. Perhaps it is as clear as the SP500.
SP400 is a bit different — holding with a doji at the 50 day EMA. On a different 50 day, the same look is evident.
RUTX a doji with tail at the 20 day EMA.
NASDAQ could test a bit more to the 50 day EMA (7742; closed at 7792) before it is ready.
SOX was down, gapping back below the 50 day EMA. It stopped at the 20 day EMA and pretty much filled the upside gap from Monday. While this forecast is not as clear as the SP500’s prediction, it remains an important level for the market to try and hold the line.
NOTE: The figures and information above are as of Thursday, June 13.
Read “The Daily” Entire Weekend Summary
Here’s a trade from “The Daily” and insights into our trading strategy:
Chart by StockCharts.com
DE (NYSE: Deere & Company)
Company Profile
Sexy is in the eye of the beholder, particularly when the beholder is a brokerage account. DE may not be the most glamorous stock in the market, and with the China trade war, it is no longer the beloved green and yellow we all know from the farm belt. Indeed, it was more like black and blue in May. However, the saying is that out of adversity arises opportunity. If you did not play it as it fell, you could play it as it recovered. Or both.
We saw the nasty gap lower on 5/17 to the old support level. Then, DE stopped there and immediately rebounded. When the sellers take a stock down hard but cannot keep it down, you take notice. DE bounced, tested and then jumped into the gap zone on 5/29. When that happens, a gap fill is likely. We put it on the report, and then, as DE moved higher, we entered with some July $140 strike call options for $7.00 since the stock was trading at $142.38.
DE had one more quick test for the move, rebounding intraday. Then, it proceeded to move higher. While it was not running like a deer, it was not plodding either. After experiencing a steady upside for six sessions, it touched the 50 day EMA, our initial target, on 6/10. We sold half the position for $12.00, banking just over 70%. It tested a bit and is now back at the 50 day EMA. We are watching to see if it can break higher and fill the next gap up at 155. If it moves higher, we’ll let it. If it stalls here, we will bank the rest of the solid gain.
SNAP (Snap Inc.)
Infinitely sexier than DE — but having the same profitability — SNAP caught our eye in late May as it prepared to breakout from an eight week base that was acting as the right shoulder to a much larger 13-month inverted head and shoulders pattern. We saw it break upside off the 50 day SMA on 5/29 and put it on the report. On 5/30, SNAP broke nicely higher.
We entered with some stock at $11.95 and some October $11.00 call options for $2.20. While this was a nice initial move, it took SNAP another couple of sessions to snap to it. It made a quick doji-test of the 10 day EMA then shot higher on 6/4. It then blasted higher on into the end of last week, coming ever so close to our initial target. Then, SNAP spent the week in a lateral consolidation on extremely low trade. This was perfect as the stock was consolidating a good move and no one was selling.
On Thursday, SNAP was on the move again. It gapped upside, rallied on a good shot of volume, broke into a higher rally high and hit the initial target. Per the plan, we sold half our stock for $14.21, banking almost 19%. We then sold half of our options for $3.75, banking 70%. Not only does the October expiration give us time to let it work, with this break higher, it looks as if SNAP wants to work some more.
Receive a 2 week trial and if you stay on receive a $30 per month discount!
2) STOCK SPLIT REPORT
Here’s a leader play and our current analysis.
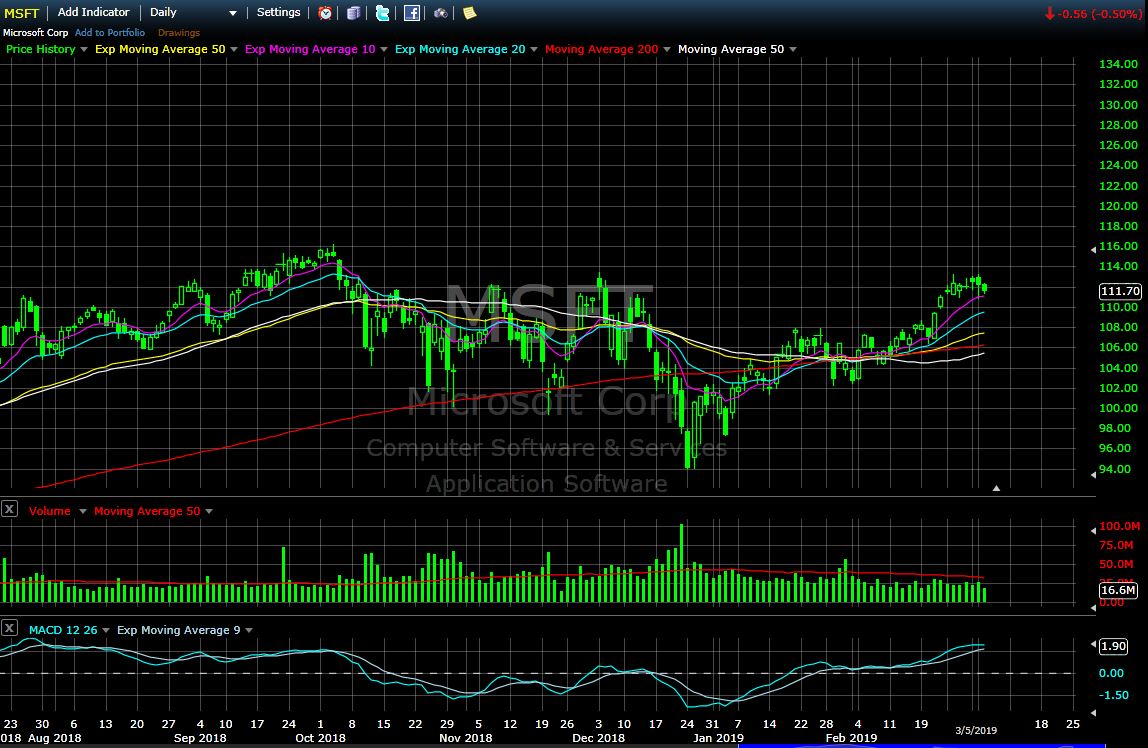
NASDAQ:MSFT (Microsoft– $131.49; -0.60; optionable): Operating System and Cloud Computing
EARNINGS: 07/24/2019
STATUS: MSFT broke out on Friday and Monday and cleared the late April high that had precipitated its most recent seven week base. After it broke out and experienced a good volume of trades, it then started to fade on Monday as it closed off the high, gapped higher Tuesday and then began to weaken. On Wednesday, there was a very modest drop to a doji and very light trade. While the stock experienced a good volume on the upside, the test was weaker. This is perfect. While we may want to test a bit more, Wednesday’s low touched the breakout point at $130.50. In any event, we are ready to move in when MSFT makes the move higher. A rally to the target will gain 60%ish on the call options.
Volume: 17.092M Avg Volume: 25.282M
BUY POINT: $132.11 Volume=28M Target=$138.88 Stop=$129.85
POSITION: MSFT AUG 16 2019 130.00C – (58 delta)
Learn more about our Stock Split Report and how we have made gains of 321% with our powerful stock split plays!
Save $360 per year on the Stock Split Report! Plus 2 week trial!
3) IH ALERTS
NYSE:UBER (Uber–$42.17; -0.28; optionable): Transportation
EARNINGS: 08/29/2019
STATUS: UBER formed its first base on May 16 and broke out 6/5. It then experienced a strong upside break to a new high on a strong trading volume. It then faded over the past week in a very orderly, low volume fashion. It then held to the 20 day EMA during the Tuesday and Wednesday lows and rebounded as the market closed. This is a great set up. We will move in after there is a solid break higher through the entry point. A rally to the target will gain 14% on the stock and 80%ish on the options.
Volume: 5.965M Avg Volume: 29.451M
BUY POINT: $42.68 Volume=25M Target=$48.97 Stop=$40.57
POSITION: UBER SEP 20 2019 42.00 C – (56 delta) &/or Stock
Save $600 per year and enjoy a 2 week trial of our IH Alerts Service!
4) SUCCESS TRADING GROUP
— by the MarketFN STG Team
NASDAQ:ADM (Advanced Micro Devices Inc.)
Company Profile
Our Success Trading Group members scored another winning trade this week when we closed out a position in Advanced Micro Devices Inc. (NYSE:ADM) We are watching other several stocks and are looking forward to trading next week.
Our Success Trading Group closed seven years with zero losses on our Main Trade Table. In fact, we closed 100% winning trades for the calendar years 2016, 2015, 2013, 2012, 2011, 2010 and 2009. We still have one open position from 2017 (all others were winners) and one trade that we opened in 2014 but was closed as a losing trade.
All of these trades are posted on our Main Trade Table for your review during your free membership trial period.
Get Our Next Trade Free – Save $50 per month! Details Here.
5) COVERED CALL PLAY
NASDAQ:CZR — Caesar’s Entertainment Corp. is currently trading at $9.81. The July $10.00 Calls (CZR20190720C00010000) are trading at $0.41. That provides a return of about 5% if CZR is above $10.00 on expiration Friday in July.
Learn more about our Covered Call Tables
PREMIUM SERVICES
IH Alerts: InvestmentHouse.com’s Best of The Best Plays!
Stock Split Report: Forbes.com Best of the Web
Covered Calls: Allowed in your IRA – Energize your portfolio!
The Daily: “The Daily” is a must read for all investors!
Success Trading Group: 7 years without a trading loss!
The foregoing is commentary for informational purposes only. All statements and expressions are the opinions of Online Investment Services, LP., or Split Ventures, Ltd. This information is not meant to be a solicitation or recommendation to buy, sell, or hold securities. We are not licensed or registered in the securities industry. The information presented herein and on the related web site has been obtained from sources believed to be reliable, but its accuracy is not guaranteed. The security portfolios of writers for this issue may, in some instances, include securities mentioned herein and on the related web site. Estimates, assumptions and other forward-looking information are subject to the limits of forecasting. Actual future developments may differ materially due to many factors. No one associated herewith receives compensation in any manner from any of the companies that are discussed in this newsletter or on the related websites.
