Weekender for 8/15
1. Market Summary
Excerpted from Thursday’s paid content of Investment House Daily by Jon Johnson.
The Producer Price Index Surges to All-Time Highs
– The Producer Price Index (PPI) surges to all-time highs, and so does the S&P 500 and DJ30.
– Inflation? What’s inflation? The large-cap NYSE stocks rally to new highs, and the Nasdaq big names start moving upside again.
– The PHLX Semiconductor Sector (SOX) is still ready to make a break higher.
– We saw some very good setups in place heading into Friday.
The musical chairs of daily leaders continues. On Wednesday, it was the mid-cap stocks, the Dow and small-cap stocks that were leading upside. On Thursday, they paused as the Nasdaq led. However, the S&P 500 was close behind, given the performance of some of the largest-cap stocks. While the DJ30 was flat, the SOX was down again. It actually dropped to the April high on the close, after undercutting that level intraday. Okay, if Wednesday was a nice shakeout and rebound setup, surely the SOX is ready to break higher after Thursday, right?
Yes, each session is back and forth, and one index trades the position of leader for another, but that is not that bad, in general. Indeed, the market is trending higher overall. The indices are trading off of the upside regularly, and if new leadership arises, that is great. Still, however, we are finding a significant number of stocks that are struggling to put together sustained moves. Are they perhaps treading water? Is the overall market treading water?
Perhaps. On Thursday, however, the big Nasdaq names started moving back upside — Apple led the move with Facebook and Microsoft working well. We have noted that the mega-cap Nasdaq stocks have pulled back. In some cases, they were setting themselves up for moves. Apple was one of these, as it posted a nice gain on Thursday. Perhaps those big names are ready to lead again.
P.S. Las Vegas Money Show, September 12-14, Bally’s Hotel & Resort: Join me and many other speakers. For more information, go to Johnson.MoneyShow.com. A special registration code of 053412 is embedded in the link to help my readers secure early bird pricing and a seat at the event.
NOTE: The figures and information above are from the 8/12 report.
Watch the Investment House Video For This Week Here!
NOTE: The video is from the 8/11 report.
2. Targets Hit
Here are two completed trades from Investment House Daily, offering insights into our trading strategy and the targets that we have hit this week:
ZoomInfo Technologies Inc. (NASDAQ: ZI): This week, we banked the last quarter of the gain (61.7%) on the play that we initiated on July 22. After ZI posted a solid rally during the first week of July, we banked profits twice: 98% on Aug. 3 and 168% on Aug. 5.
Then, ZI started to give back some of the move and gapped lower on Aug. 9. That prompted us to take the last quarter of the position off of the table. As a result, we are sitting on a nice profit.
Microsoft Corporation (NASDAQ: MSFT): We initially banked some gains in this position back on July 26. That is, the stock made a good move, we banked some gains and then left half of the position to work. Well, MSFT worked, but in a lateral move for about two-and-a-half weeks.
On Thursday, MSFT started higher again, then gapped upside and rallied. It then started to waffle, however, after the first hour. So, we opted to sell another half of the position and banked another 55% gain.
We are waiting to add a new position with options that are another month or two out (we sold our September options), as MSFT is starting a breakout from that two-and-a-half-week pennant pattern it had formed.
Receive a risk-free trial to Investment House Daily and save 50% by clicking here now!
Here are several completed trades from Technical Trader Alert, offering insights into our trading strategy and the targets that we have hit this week:
Coinbase Global Inc. (NASDAQ: COIN): While this was a new issue in mid-April, COIN did nothing but fall from its initial public offering (IPO) price. After it slid lower into May, it finally found a floor.
After some work, COIN was setting up a base by early August. We like to play IPO stocks after their first bases, and following a pullback, COIN set up a base-on-base pattern. It first formed a triangle from mid-May to late June. It then broke higher from that pattern, but it did not have a lot of traction. After it faded, it formed a nifty, inverted head-and-shoulders pattern over the course of five weeks.
Once that happened, we were very interested and put COIN on the report. Earnings were to be released after the market closed on Aug. 10, and COIN looked well-positioned for a pre-earnings move.
On Aug. 4, COIN made the break higher we wanted and moved up through the 50-day simple moving average (SMA). As that was our entry signal, we purchased September $240 call options for $22. This nice, slightly in-the-money position gave us a good delta on the options.
That session was the breakout move from the inverted head-and-shoulders pattern, and the breakout had momentum. Over the next three sessions, COIN moved from $241 to $282.43. Indeed, on Aug. 9, COIN hit our initial target.
So, we sold half the position for $45 and banked a 104% gain. Since the next session would feature earnings, and COIN was sluggish, we opted to sell another half of the position for $39.50 and bank a 79.5% gain.
That left a quarter of the position in our portfolio before earnings. COIN has shown that it can be volatile, so we did not want to be too heavy in the position.
Our concerns were unfounded, as COIN beat earnings expectations. On Aug. 11, it jumped higher to $294 during the early session. Then, we did a quick analysis of the numbers and concluded that COIN would not get much better than it was in the near term.
Accordingly, we sold the remaining options for $52.50 and banked a 138% gain. Our analysis proved correct, as COIN proceeded to give back that early surge to close lower on the session. It then gapped downside on Thursday. It held the 50-day exponential moving average (EMA), however, and that leaves a new play on the breakout test open for us.
We also took gains in the following positions:
Foot Locker, Inc. (NYSE: FL): 28% gain in the put options.
Goldman Sachs Group Inc. (NYSE: GS): 90.6% gain in the call options.
Steel Dynamics, Inc. (NASDAQ: STLD): 73% and 122% gains in the call options.
Vulcan Materials Company (NYSE: VMC): 57% gain in the call options.
Receive a risk-free trial to Technical Trader and save 50% by clicking here now!
Here are four completed trades from the Success Trading Group , offering insights into our trading strategy and the targets that we have hit this week:
Cleveland-Cliffs Inc. (NYSE: CLF): Industrial metals and minerals have been a hot-and-cold group during this rally. They have continued trending higher, but are definitely moving in waves. During the second week of August, they were catching a wave.
Indeed, CLF moved higher into late June and then tested to the 10-day EMA, forming a handle to a double-bottom base. On Aug. 9, CLF broke higher off the 10-day EMA. This was the entry signal, and we bought stock for $24.70. CLF did not waste time. It rallied again on Aug. 10 and hit our target. As a result, we sold the position for $25.68 and banked a 3.97% gain.
We also took gains in these positions:
Chewy Inc. (NYSE: CHWY): 3.88% gain.
Masco Corp. (NYSE: MAS): 4.31% gain.
Terex Corporation (NYSE: TEX): 3.88% gain.
Now is a good time to become a member of the Success Trading Group. The system is geared towards bringing you consistent, short-term gains of 5-10% and you can expect four to six trades every month.
To receive a risk-free trial and save 50%, click here now!
3. Pick of the Week
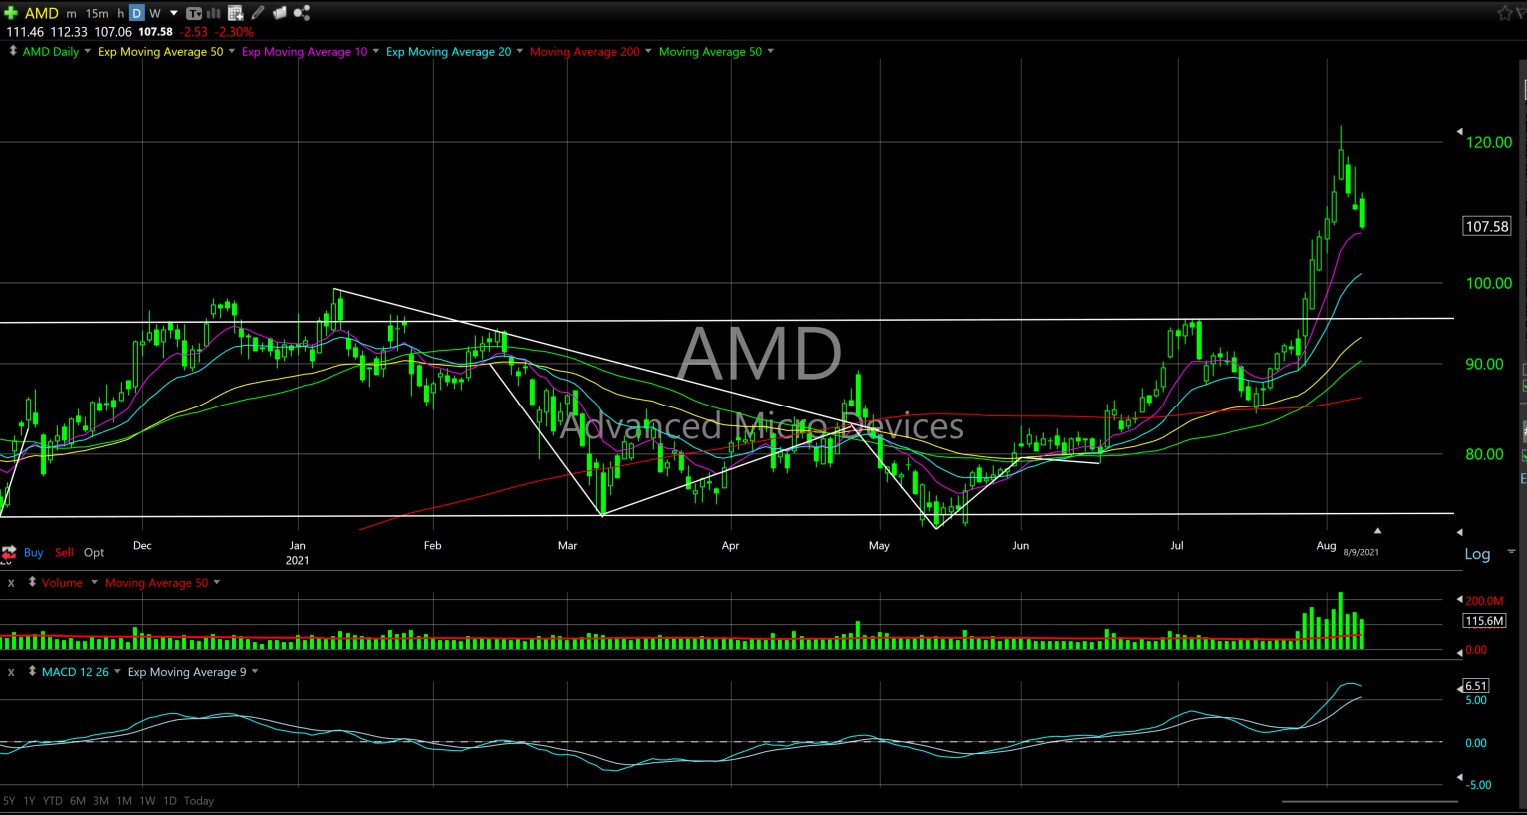
AMD (Advanced Micro Devices — $107.58, -2.53)
EARNINGS: 10/26/2021
STATUS: AMD almost single-handedly led the SOX, which, in turn, led the market higher from late July to early August. Strong earnings broke AMD higher out of a 12-month trading range. The stock peaked last Wednesday and faded into Monday with a 10-day EMA test.
We may want to test some more, but AMD is strong. So, it should make a bounce from this range. We want to play that move with a run to the target. This will give us a 75% gain in the options.
VOLUME: 115.75M Avg Volume: 67.23M
ENTRY POINT: $108.38 Volume=120M Target=$119.98 Stop=$106.21
POSITION: AMD OCT 15 2021 110.00 Calls — (50 delta)
To see the chart for AMD, click here!
4. Covered Call Options Play
Hut Eight Mining Corp. (TSE: HUT) — Hut Eight Mining Corp. is currently trading at $6.57. The Sept. 17 $7.50 Calls (HUT20210917C00007500) are trading at $0.77. That provides a return of about 29% if HUT is above $7.50 by the expiration.
