Weekender for 9/6
1. Market Summary
Excerpted from Thursday’s paid content of Investment House Daily by Jon Johnson.
No Real Catalyst, Just Gravity
– After the Wednesday breakouts, Thursday featured a nasty reversal as the market did not wait for Friday’s jobs report.
– We saw big price losses, heavy volume and serious downside breadth.
– There was no real catalyst, just gravity. The economic data are still solid-ish.
– After the quick correction, will there be more upside or will it be prolonged? No one knows the depth, so we will take what we can in our positions.
The selling started a day earlier than anticipated with futures opening down hard at -183 on the NASDAQ. Trading was weak all morning, but dominated by the NASDAQ. The Dow was off by 20 points and the NASDAQ was off by 150 points. Trades definitely skewed toward tech stocks.
An attempted bounce on the better jobs report died quickly. The move lower continued into midmorning. A bounce died off at about midday and the indices went south into the last hour. A modest bounce was just that — a modest bounce that did not undo the damage.
In the end, the trajectory was an old-fashioned tail that kicked in after a steady move higher. The method of the reversal, the surges on Wednesday with new breakouts and the sharp selling that reversed the moves, all added an extra measure of harshness.
Technical Analysis:
The small-and-mid-cap stocks fell through the 20-day exponential moving average (EMA) and toward the 50-day moving average (MA). This is not a surprise as they were lagging. Perhaps it was a surprise, because, even though they lagged, they should have felt the rotation if it had existed. Instead, they felt the sting of the selling.
NASDAQ: The NASDAQ moved from a gap to a doji on Wednesday to a gap and selloff to the 20-day EMA on rising and above-average volume. As the index managed to hold the 20-day MA, there was much rejoicing.
S&P 500: It gapped higher on Wednesday, gapped back down on Thursday and sold to the 20-day EMA on the low. This index featured above average volume as well.
NOTE: The figures and information above are from the 9/3 report. There were no videos this week.
2. Targets Hit
Here are several completed trades from Investment House Daily, offering insights into our trading strategy and the targets that we have hit this week:
Broadcom Inc. (NASDAQ: AVGO): 65% gain on the options
Amazon.com, Inc. (NASDAQ: AMZN): 32% gain on the options
Chewy Inc. (NYSE: CHWY): 29% gain on the stock, 140% gain on the options
Cummins Inc. (NYSE: CMI): 114% gain on the options
Crowdstrike Holdings Inc. (NASDAQ: CRWD): 215% gain on the options
CSX Corporation (NASDAQ: CSX): 30% gain on the options
Nike Inc. (NYSE: NKE): 86% gain on the options.
NVIDIA Corporation (NASDAQ: NVDA): 151% gain on the options
Sunrun Inc. (NASDAQ: RUN): 16% gain on the stock, 52% gain on the options
Workhorse Group Inc. (NASDAQ: WKHS): 19% gain on the stock, 45% gain on the options
Receive a risk-free trial to Investment House Daily and save 50% by clicking here now!
Here are several completed trades from Technical Traders Alert, offering insights into our trading strategy and the targets that we have hit this week:
Adobe Inc. (NASDAQ: ADBE): 135% gain on the options
Salesforce.com, inc. (NYSE: CRM): Closed the position with a 300% gain
Chewy Inc. (NYSE: CHWY): 63% gain on the options
Docusign Inc. (NASDAQ: DOCU): 160% gain on the options
Marriott International Inc. (NASDAQ: MAR): 55% gain on the options
NVIDIA Corporation (NASDAQ: NVDA): 151% gain on the options
Zillow Group Inc Class C (NASDAQ: Z): 75% gain on the options
Receive a risk-free trial to Technical Trader and save 50% by clicking here now!
Here are several completed trades from the Success Trading Group, offering insights into our trading strategy and the targets that we have hit this week:
Morgan Stanley (NYSE: MS): It looked as if financials were going to recover, as they set up some very nice patterns into late July. MS sported a nice cup-with-handle pattern, the handle of which tested back to the 20-day EMA. On July 27, the stock broke higher off of the 20-day EMA. So, we bought stocks for $51.53.
MS looked great until financials lost their bid, and MS slid back to the 50-day MA to end the month of July. From there, it started higher in August. However, it was a slow move.
The stock rallied nicely into the second week of the month and looked great. Then, it slipped right back to the 20-day EMA in the middle of the month. From there, it moved back and forth along the 20-day EMA. In early September, MS finally broke higher again. As a result, we sold the position for $53.45 and banked a 3.7% gain.
CSX Corporation (NASDAQ: CSX): As the market looked like it was going to reward the recovery stocks, CSX set itself up well until mid-August. The stock formed a nice cup-with-handle pattern and started higher in the middle of the month. We moved in and bought stocks for $75.18 on Aug. 17.
While it was not all straight up for CSX, it was a slow and steady move up the 10-day EMA. At the end of the month, CSX hit our target. While we waited to see if there was any more potential in this play, there was not. As a result, we sold the position for $77.42 and banked a 2.98% gain.
Now is a good time to become a member of the Success Trading Group. The system is geared towards bringing you consistent, short-term gains of 5-10% and you can expect four to six trades every month.
To receive a risk-free trial and save 50%, click here now!
3. Pick of the Week
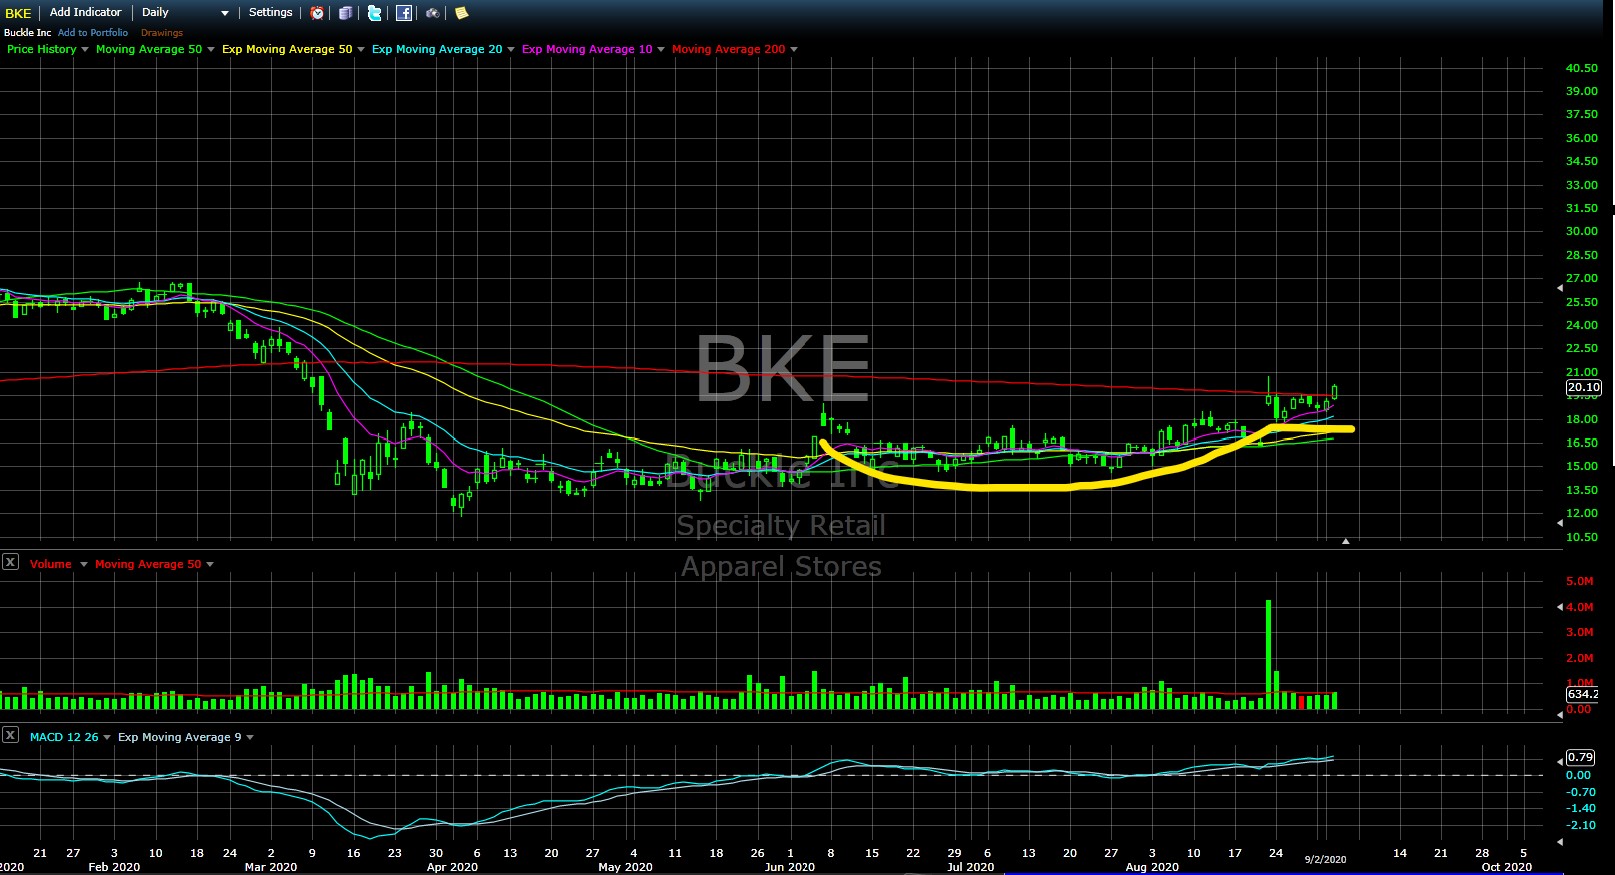
BKE (Buckle, Inc. — $20.10) +0.98
EARNINGS: 11/20/2020
STATUS: Cup with handle. Retail is showing excellent action, and BKE is another retail chain which, after buckling, has recovered nicely. BKE gapped up to the 200-day simple moving average (SMA) during the third week of August, but could not hold a move. That action, however, helped form a three-month cup-with-handle. This pattern is part of a larger base that started, of course, off of the February high into March — you know that story.
After a couple of weeks working laterally below the 200-day SMA, BKE broke higher on Tuesday on rising and above-average volume. This was due to the fact that money was again being allocated toward retail stocks. It is also important to note the break out in the moving average convergence/divergence even at this lower price level — this shows good momentum.
We want to play a continued break higher for a run at some gaps lower from February. That move will give us a 20% gain on the stock and a 90% gain on the options.
VOLUME: 624.044K Avg Volume: 646K
ENTRY POINT: $20.24 Volume=750K Target=$24.99 Stop=$18.66
POSITION: BKE NOV 20 2020 20.00 Calls — (58 delta) &/or Stock
To see the chart for BKE, click here!
4. Covered Call Options Play
Purple Innovation Inc. (NASDAQ:PRPL) — Purple Innovation Inc. is currently trading at $17.28. The Oct. 17 $17.50 Calls (PRPL20201017C00017500) are trading at $1.80. That provides a return of about 14% if PRPL is above $17.50 by the expiration.
