Yield Curve Inversion Fears Bring Out Sellers

THE WEEKEND ISSUE
Informing Investors Around The World
Read In All 50 States And Over 100 Countries
Weekend Newsletter for
March 24, 2019
Table Of Contents 1) MARKET SUMMARY from THE DAILY 2) STOCK SPLIT REPORT 3) IH ALERTS 4) SUCCESS TRADING GROUP 5) COVERED CALL SERVICE

1) MARKET SUMMARY > >From “The Daily” by Jon Johnson at InvestmentHouse.com
Friday was likely inversion panic, but was it even warranted?
– Weak German PMI reports, weak Japanese output, yield curve inversion fears bring out the first serious sellers in a long time.
-After a solid break upside Thursday, SP500 and NASDAQ are sold back into the range.
-Small and midcaps threaten to break their uptrends.
-The market never peaks the first day of an inversion, so even if Friday was a yield curve inversion with meaning, the top is still a lot of upside moves away.
-Even if this wasn’t an inversion to worry about, the move itself deserves respect, and some areas look very ready to sell.
Market Summary (continued)
Thursday night I said it looked as if the NASDAQ and SP500 test of the breakout over the top of the range was over. It was not. After a Thursday that saw stocks jump back up after a modest fade into the FOMC decision Wednesday that LOOKED like a successful NASDAQ and SP500 test of the trading range, stocks made a second rather important move: back down.
NASDAQ and SP500 reversed the Thursday gains and more, falling back into the upper reaches of the range. Not a horrible finish for those two indices, but NYSE volume jumped higher and breadth was impressive to the downside.
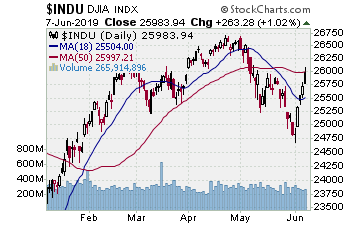
SP500 -54.17, -1.90%
NASDAQ -196.29, -2.50%
DJ30 -460.19, -2.50%
SP400 -2.81%
RUTX -3.62%
SOX -2.88%
NASDAQ 100 -2.23%
VOLUME: NYSE +21%, NASDAQ flat but above average. NYSE trade ramped as NYSE stocks sold across the board. Many times I have discussed the lack of sellers. Friday they showed up as fear of being late to get out on an inverted yield curve sparked selling. First, there is not that much evidence a 3 month/10 year inversion presages recession, and second, it is never the case the market peaks on the very day (Friday) the inversion occurs. Indeed, you can get smacked around pretty good playing it that way. Nonetheless, you have to respect the selling if nothing more than near term issues for stocks.
ADVANCE/DECLINE: NYSE -4.1:1, NASDAQ -4.9:1. Impressive downside as SP400 and RUTX broke below the 50 day MA’s with RUTX closing below the early March low.
As the headline numbers and the internals show, it was a shellacking across the board with very few places unscathed.
Read “The Daily” Entire Weekend Summary
Here’s a trade from “The Daily” and insights into our trading strategy:
Chart by StockCharts.com
As usual, with a good rally working, many positions were hitting targets and initial targets and we were banking gain according to the plans for each position.
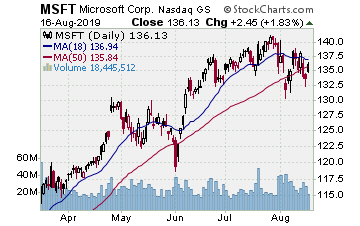
MSFT (Microsoft Corp.)
Company Profile
Entered this play on 3/11 as MSFT moved through resistance. Bought May $110.00 strike call options for $5.80 with the stock at $112.17. MSFT moved in a straight line higher to the target and we sold some options last week for $9.70, banking over 65%.
AAPL (Apple, Inc.)
Company Profile
Bought into AAPL 2/13, just in time to see AAPL fail a break upside and continue moving laterally into early March. We were playing April $170.00 calls purchased for $8.30. Took a while but AAPL finally got going. Thursday AAPL broke over the 200 day SMA and we banked some options for $24.15, gaining 190%.
NVDA (NVIDIA Corp.)
Company Profile
Entered this one 3/12 at $162.54 with May $160.00 strike call options for 13.30. NVDA pretty much moved straight up to the target as of Thursday. We sold some options for $28.85, banking over 115%.
CMG (Chipotle Mexican Grill Inc.)
Company Profile
Moved into this leader as it broke higher on 3/4, starting a new run. Bought some May $615.00 strike call options for $37.80. CMG stepped nicely higher hitting the target Tuesday. We banked half the gain, selling for $67.00 and a 75+% gain.
Receive a 2 week trial and if you stay on receive a $30 per month discount!
2) STOCK SPLIT REPORT Here’s a leader play and our current analysis.
Chart by StockCharts.com
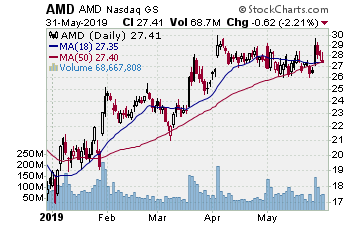
AMD (Advanced Micro Devices–$26.37; -1.52; optionable): Semiconductors
Company Profile
EARNINGS: 04/30/2019
STATUS: Cup w/handle. Nice 7 month base with a 2 month handle formed into last week. Tuesday AMD broke higher, added some Thursday, then sold back Friday on lower volume in that broad selling on yield curve inversion fears. Low volume shows no real selling, at least compared to the buying that preceded it. AMD may want to come back some more to start the week, but we want to be ready whether AMD tests further or it wants to jump higher from the Friday close. On a test back near the 10 day EMA at 25, we want to pick it up as it rebounds. Otherwise we buy a move higher from here.
Volume: 115.323M Avg Volume: 69.702M
BUY POINT: $26.91 Volume=115M Target=$32.39 Stop=$25.09
POSITION: AMD MAY 17 2019 26.00 C – (57 delta) &/or Stock
CHART IMAGE
Learn more about our Stock Split Report and how we have made gains of 321% with our powerful stock split plays!
Save $360 per year on the Stock Split Report! Plus 2 week trial!
Chart by StockCharts.com
3) IH ALERTS
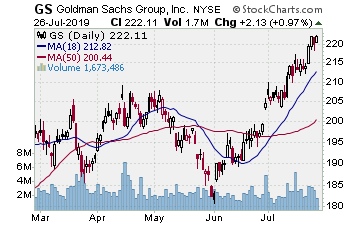
GS (Goldman Sachs–$188.96; -5.62; optionable)
Company Profile
EARNINGS: 04/17/2019
STATUS: Most of the financials cannot win in this environment and GS, after breaking higher from a 9 week lateral consolidation last Monday, rolled right back over and sold off through the 50 day MA’s. A rejected breakout or breakdown is a strong signal. We want to play GS for a fill of that gap upside from mid-January. It may try to bounce some Monday as it suffered the past week, breaking below the 50 day MA’s. If so, we let it, then as it turns back over after bumping those levels, we move in. If it sells from here in a continued weak market, we go ahead and move in. A move to the target from the current entry lands a 45%ish gain on the put options.
Volume: 5.703M Avg Volume: 2.818M
BUY POINT: $187.77 Volume=4M Target=$179.89 Stop=$190.44
POSITION: GS MAY 17 2019 190.00P – (-48 delta)
CHART IMAGE
Save $600 per year and enjoy a 2 week trial of our IH Alerts Service!
Chart by StockCharts.com
4) SUCCESS TRADING GROUP–by the MarketFN STG Team
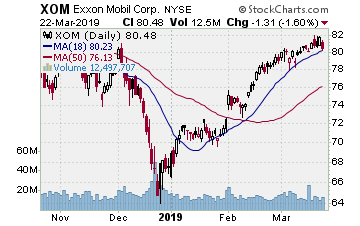
XOM (Exxon Mobil Corporation) Company Profile
Our Success Trading Group members closed two winning trades this week including one on Exxon Mobil Corporation (Ticker: XOM). We have several stocks on our radar and are looking forward to trading next week.
Our Success Trading Group closed7 years with 0 losses on our Main Trade Table. In fact, we closed 100% winning trades for the calendar years 2016, 2015, 2013, 2012, 2011, 2010 and 2009 (we still have 1 open position from 2017 (all others were winners) and 1 trade that we opened in 2014 was closed as a losing trade). All of these trades are posted on our Main Trade Table for your review during your free membership trial period.
Get Our Next Trade Free – Save $50 per month! Details Here.
Chart by StockCharts.com
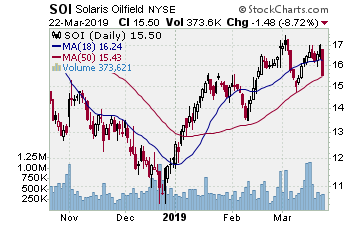
5) COVERED CALL PLAY
SOI – Solaris Oilfield Infrastructure Inc. is currently trading at $15.50. The May $15.00 Calls (SOI20190518C00015000) are trading at $1.35. That provides a return of about 7% if SOI is above $15.00 on expiration Friday in May.
