Weekender for 9/26
1. Market Summary
Excerpted from Thursday’s paid content of Investment House Daily by Jon Johnson.
*************************** Special Invitation *******************************
I’ve received questions from subscribers who said they’d like to get everything I publish, but the price tag was — quite frankly — too high. I gave it some thought and I worked with my publisher on an offer that we call Investment House Traders Alliance. When you join the Alliance, you receive a lifetime subscription to all three of my products for a one-time fee (plus a very small annual maintenance fee). However, my publisher is only allowing 21 people to get this limited offer as we enter the fourth quarter of 2021. Call Grant Linhares at 202-677-4492 for all the details and he’ll give you a customized, personal quote.
**************************************************************************
The Upside Continues
– The upside continues as the S&P 500 moves through the 50-day moving average. Even so, many big names are still showing bearish action even during this bounce.
– Lagging areas try a rebound, as they have in the past. Will the rotation succeed this time or fail?
– The economic data were so-so. On Friday, we watched the big names and saw how they moved at their respective resistance levels.
On Thursday, the rebound continued as the S&P 500 approached a serious level from its break lower. However, it was not a done deal, even as futures were higher — futures also were backpedaling off of those highs as the market open time approached. It looked as if there might be another session of higher early prices that reversed.
Nope. The open saw stocks surge into the time that European markets closed, pause and then rally to mid-afternoon. A pullback did finally take shape, as stocks fell during the last two hours. They are still holding their solid gains, but the action was off of its best game in the second half of the afternoon.
NOTE: The figures and information above are from the 9/23 report.
Watch the Investment House Video For This Week Here!
NOTE: The video is from the 9/22 report.
2. Targets Hit
Here are several completed trades from Investment House Daily, offering insights into our trading strategy and the targets that we have hit this week:
Salesforce.com, Inc. (NYSE: CRM): A breakout in August and then a classic test of the breakout into mid-September set up a strong gain. CRM formed a triangle in a trading range from the month of June. It broke higher in August and peaked the move late in the month. It then faded in a two week test to the 50-day MA, landing right on top of the prior base as it tested. At the prior base highs, there was plenty of solid support to bounce. It did.
On Sept. 16, CRM broke higher off of the 50-day MA, and we moved in with November $270 call options for $7.10 and $260 call options for $11.70. CRM edged higher, but then faded to test the 50-day MA a second time through Monday.
After it held the second test, CRM surged higher with a gap and rally on Thursday. We banked half of the gain by selling the $270 calls for $16. This produced a 125% gain. On Friday, CRM was up again. So, we sold more $270 strike options for $19.70. This produced a 177% gain. We also sold some of the CRM $260 calls for $25.80 and banked a 120% gain.
We also took gains in the following positions:
Nike Inc. (NYSE: NKE): 160% gain in the put options.
Cliffs Natural Resources (NYSE: CLF): 75% gain in the put options.
Yum! Brands, Inc. (NYSE: YUM): 69% gain in the put options.
Receive a risk-free trial to Investment House Daily and save 50% by clicking here now!
Here is one completed trade from Technical Trader Alert, offering insights into our trading strategy and the target that we have hit this week:
Adobe Inc. (NASDAQ: ADBE): ADBE was one of the staunchest stocks in the strong rally in the software sector. Thus, when we looked at a downside play in September, some of us raised our eyebrows. How could we believe that ADBE would fall? Well, the pattern told us so.
ADBE broke higher again during the second half of August and looked solid as it rallied off of a 20-day exponential moving average (EMA) test. It then put in almost two weeks of upside. As it rallied, however, the volume faded.
The moving average convergence divergence (MACD) faded as well. As ADBE punched new price highs, the MACD made lower highs. This indicates that momentum was fading. When we combined that with the low volume, new highs and the rounded top that was forming, we were presented with a picture of a stock that was ready to test its move. It would not collapse massively, but it would surely test.
We saw ADBE dip in mid-September for a session, but it immediately rebounded during the following three. It then moved back near the highs. After it stalled, it broke lower on Sept. 20. That was our signal. So, we entered the play with November $650.00 put options. We paid $31.65 for those options.
ADBE held its ground over the 50-day MA on Tuesday, but on Wednesday, it broke and gapped below the 50-day MA. Then, ADBE moved to near our initial target and started to hold the line. We know that downside breaks are sharp and fast. They can also quickly dissipate.
We sold half of the position for $45.60 and banked a 44% gain — not bad for less than two days. We let the rest work, and after a quick bounce to test the 50-day EMA break on Thursday, ADBE is rolling back over. As a result, we anticipate another sharp decline.
Receive a risk-free trial to Technical Trader and save 50% by clicking here now!
3. Pick of the Week
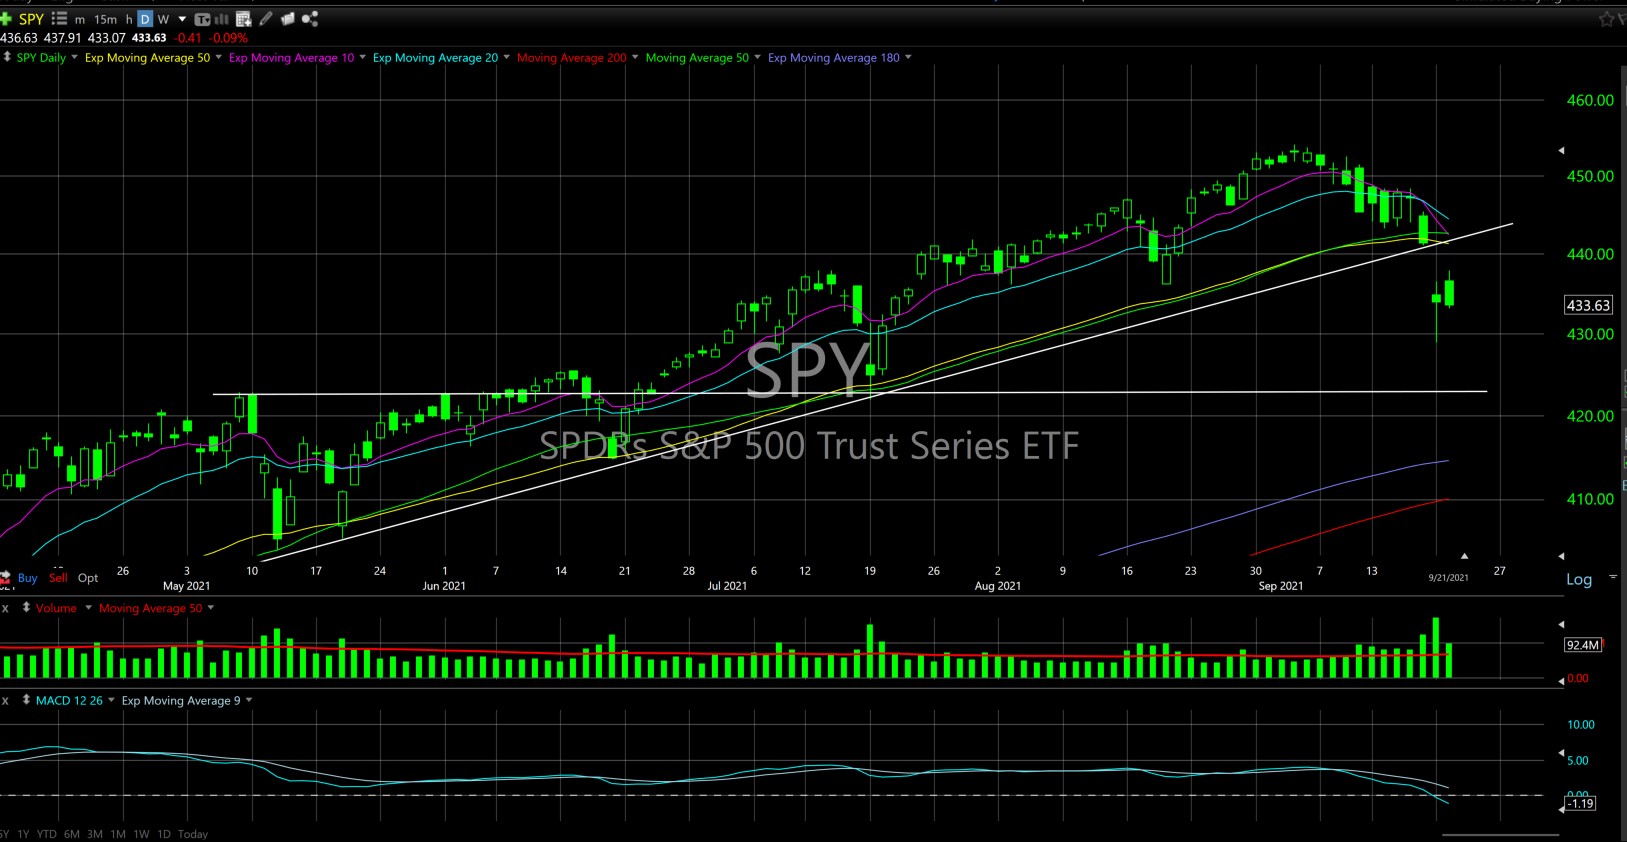
SPY (S&P 500 ETF — $433.63, -0.41)
EARNINGS: N.A.
STATUS: There is no mystery here as the S&P 500 broke the 50-day MA on the Monday gap and rebounded on Tuesday with an upside gap that backtracked and lost ground. The index then tried to rally but failed.
As SPY continues lower, we are ready to move in for a drop near the mid-July low. That move will give us a 55% gain in the October options.
VOLUME: 92.526M Avg Volume: 65.108M
ENTRY POINT: $433.05 Volume=95M Target=$423.42 Stop=$436.08
POSITION: SPY OCT 15 2021 $433.00 Puts — (-49 delta)
To see the chart for SPY, click here!
4. Covered Call Options Play
Luna Innovations Incorporated. (NASDAQ: LUNA) — Luna Innovations Incorporated is currently trading at $9.87. The Oct. 15 $10 Calls (LUNA2021115C00010000) are trading at $0.50. That provides a return of about 10% if LUNA is above $10 by the expiration.
