Weekender for 10/10
1. Market Summary
Excerpted from Thursday’s paid content of Investment House Daily by Jon Johnson.
Debt Ceiling Deal Gaps Stocks Upside
– Debt ceiling deal gaps stocks upside.
– There were nice gaps by the large-cap stocks, but they faded to tombstone dojis.
– Bond yields surge back upside. Meanwhile, the jobs report premarket session and the large-cap indices were set for a possible drop.
Senate Republicans caved on the debt ceiling issue. As a result, stocks jumped and bonds dropped. There are certain things you can count on, including fall following summer, the hope each fall that your football team won’t blow it this season, President Biden not taking press questions and the Republicans caving on legislation.
This time, it was the debt ceiling, with Senator McConnell doing what he does best. That is, he enabled the “loyal opposition” to pass legislation that he claims to not want. As Mr. Spock said in one of the original Star Trek episodes, namely “Errand of Mercy,” “Curious how often you humans manage to obtain that which you do not want.”
Old science fiction aside, the concerns about the United States defaulting, toads raining from the sky and dogs sleeping with cats, passed. Stocks rallied. Futures rallied almost into the market’s open and then surged once the bell rang. All indices rallied — for all of one hour. 9:30 a.m. CST was the peak. The rest of the session saw stocks move laterally into the early afternoon and then slide lower during the last two hours. While they are still holding impressive gains, they are well off the session highs.
NOTE: The figures and information above are from the 10/7 report.
Watch the Investment House Videos For This Week Here!
NOTE: The videos are from the 10/6 report.
2. Targets Hit
Here are two completed trades from Investment House Daily, offering insights into our trading strategy and the targets that we have hit this week:
Docusign Inc. (NASDAQ: DOCU): DOCU has been one of the clear winners in the COVID-19 and post-COVID-19 times, but even thoroughbreds have to go to the barn now and then to rest. We were watching DOCU when it bumped at new highs and its volume ticked lower and lower as the moving average convergence divergence (MACD) faded lower, even on new price highs in the stock.
Then, in early September, DOCU broke higher after seven weeks of consolidation. During the next session, DOCU reversed that move.
Reversals of breakouts or breakdowns are powerful directional signals. In this case, DOCU buyers were buying hard to push it higher. The sellers then used that buying pressure to sell. More than that, they ran over the buyers and broke the breakout.
Without a doubt, we put a DOCU downside play on the report that day. On Sept. 8, we then entered the play by buying November $290 put options for $23.70.
DOCU fell nicely and then rebounded in mid-September to test the break lower. It bumped up at the 10-day exponential moving average (EMA) for several sessions, and then it started to roll back down. At that point, on Sept. 20, we picked up more put options. This time, we bought some November $270 puts for $14.90.
From there, DOCU started a trend down the 10-day EMA and picked up speed into the start of October. On Oct. 4, DOCU was hitting the 200-day simple moving average (SMA). This was a target for us on this drop. So, we issued the alert to sell our options. The $290 options were sold for $42 and produced a 77% gain. The $270 options were sold at $25.50 and produced a 71% gain.
We also took a gain this week in the following position:
JPMorgan Chase & Co. (NYSE: JPM): 65% gain in the call options.
Receive a risk-free trial to Investment House Daily and save 50% by clicking here now!
Here are two completed trades from Technical Trader Alert, offering insights into our trading strategy and the targets that we have hit this week:
Synopsys, Inc. (NASDAQ: SNPS): I stated that the market was topping back in September, even as stocks were still rising overall. The market was simply showing indications that it was going to peak, at least in the near term, and it didn’t hurt that it was the time of the year for some seasonal selling — everything was stacking up in favor of some downside.
We saw SNPS, a solid upside performer, showing weakness even as it put in a new high. When it broke some support, we were ready to enter when SNPS showed us that the time was right. That time was the second half of September, as SNPS tested its break of the near support.
We issued the buy alert for November $320 put options on Sept. 20 for $12.50, as SNPS was testing that initial break lower. SNPS bumped at the 10- and 20-day EMA for a couple of sessions and then fell. It closed over the 50-day EMA but gapped below it during the next session. That started a selling period that lasted into Oct. 4. On that day, SNPS moved lower and filled the upside gap from the third week of August.
The gap fill was our key target on this move. So, we sent an alert to sell our options for $34.50 and bank a 176% gain. After that, SNPS recovered to the 10-day EMA on the week. As a result, we are watching for SNPS to roll back over from that near resistance.
We also took a gain in the following position this week:
Netflix Inc. (NASDAQ: NFLX): 51.6% gain in the call options.
Receive a risk-free trial to Technical Trader and save 50% by clicking here now!
Here are three completed trades from the Success Trading Group , offering insights into our trading strategy and the targets that we have hit this week:
Energy Transfer LP Unit (NYSE: ET): Of course energy, oil and gas are strong right now, and, of course, we are playing those stocks. ET formed a base for four months from its June peak. In late September, it finally managed to make a break over its down trend line.
When it came back to test that break, we were ready to enter if it could resume the move. That initial breakout test is one of our favorite entry points: the base is nice and the breakout is a good signal. However, it is when the buyers return to buy at a higher price after the breakout that the base and that first move are “proved up.”
Accordingly, we were ready to enter when ET started moving up off of the breakout test. On Oct. 1, ET made the next move, and we bought the stock for $9.77. That was a Friday. On the following Monday, ET gapped higher and rallied, closing near the session high.
There was no reason not to let it run. On Tuesday, ET gapped higher again. This time, however, it just kind of hung around and stalled after the initial move. That was our cue to sell. We sold the stock for $10.15 and banked a 3.89% gain. Sure enough, ET flopped back down after that.
We also took gains this past week in the following plays:
American Superconductor Corporation (NASDAQ: AMSC): 4.08% gain in the stock.
Schlumberger NV (NYSE: SLB): 4.27% gain the stock.
Now is a good time to become a member of the Success Trading Group. The system is geared towards bringing you consistent, short-term gains of 5-10% and you can expect four to six trades every month.
To receive a risk-free trial and save 50%, click here now!
3. Pick of the Week
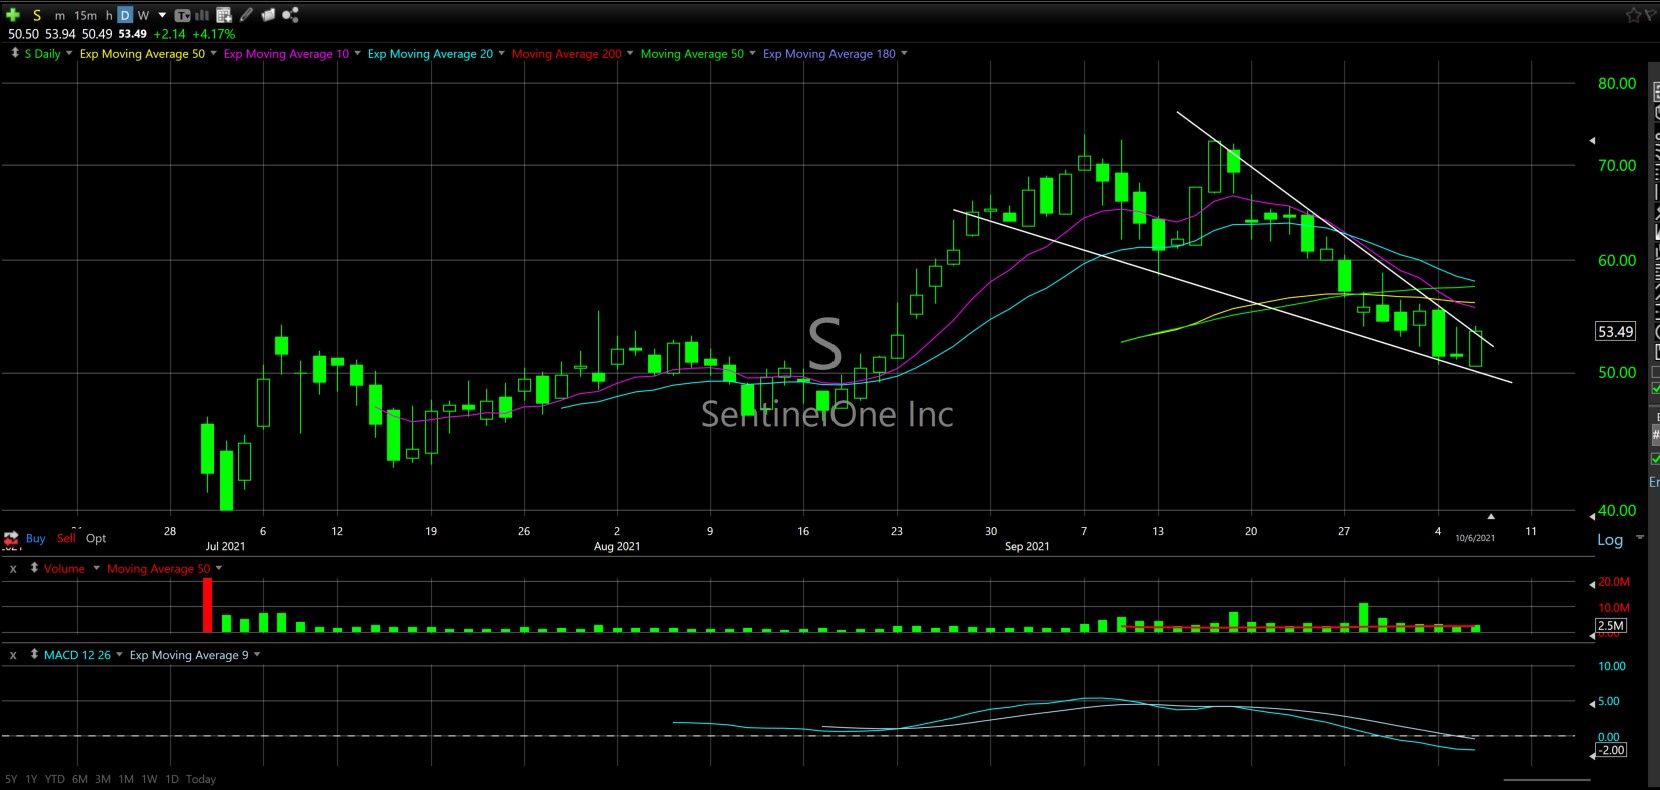
S (SentinelOne–$53.49, +2.14): Cybersecurity
EARNINGS: 12/08/2021
STATUS: While this was a new issue in late June, S went nowhere into late August. That is, it produced a nice, flat pattern around $50, but it did not make any headway. S surged starting in the third week of August and finally made the breakout move. It then rallied into early September, tested and moved to a higher high mid-month.
From there, S faded into this week and faded right back to the flat consolidation. S has formed a downward-pointing wedge, and we are looking for S to make a break to the upside from this pattern — wedges tend to break in the opposite direction of the point. A move to the target will give us a 100% gain in the options.
VOLUME: 2.454M Avg Volume: 2.79M
ENTRY POINT: $53.96 Volume=3.5M Target=$65.97 Stop=$50.63
POSITION: S DEC 21 2021 $55 Calls — (55 delta)
To see the chart for S, click here!
4. Covered Call Options Play
Consol Energy Inc. (NYSE: CEIX) — Consol Energy Inc. is currently trading at $33.89. The Nov. 19 $35 Calls (CEIX20211119C00035000) are trading at $2.50. That provides a return of about 14% if CEIX is above $35 by the expiration.
