Triple Threat Hits Stocks Friday

THE WEEKEND ISSUE
Informing Investors Around The World
Read In All 50 States And Over 100 Countries
Weekend Newsletter for
March 10, 2019
Table Of Contents 1) MARKET SUMMARY from THE DAILY 2) STOCK SPLIT REPORT 3) IH ALERTS 4) SUCCESS TRADING GROUP 5) COVERED CALL SERVICE

1) MARKET SUMMARY > >From “The Daily” by Jon Johnson at InvestmentHouse.com
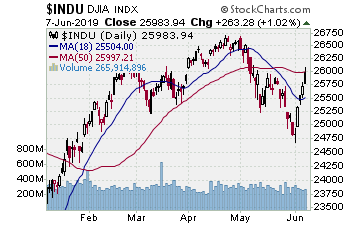
A triumvirate, threesome, trio — take your pick — of negatives hit the market Friday.
– Triple threat hits stocks Friday.
-Indices sell to the 50 day EMA as expected, show some support there as expected.
-China exports dive 20%, jobs produce just 20K, Xi/Trump trade summit put off by Chinese.
-Everyone focusing on the DJ20 and its decline as a negative, but perhaps DJ20 is just making the test and pattern before the other indices.
-Money leaves equities in 2019 as fast as the start of 2008.
-Despite the issues, the recent leaders still show excellent patterns.
Market Summary (continued)
A triumvirate, threesome, trio — take your pick — of negatives hit the market Friday. There may be more than my top 3, but my attention span is not what it used to be. Let’s face it, there is not a lot of things that are just that trustworthy to really grab your attention. Friday, was a bit different; these items were noteworthy.
The market was already weak and looked primed to test the 50 day EMA. The news gave the indices the push. When the final bell rang Friday, yes the market was down for the fifth straight session, but the indices did a credible job of testing the 50 day EMA and rebounding modestly off that support. That is as expected — the 50 day EMA was logical first support to test and try to hold. Thus far it is holding, and after 5 downside days stocks likely try to bounce, also as we expected. If they don’t, the sellers are starting to really overwhelm the bids.
That will be the story line for the coming week. As outlined last week, we anticipate some support at the 50 day EMA, and that means some type of bounce or lateral move. In reality, I don’t expect much more than an attempt at moving higher that ultimately leads to a deeper test to the bottom of the range/50 day SMA (as both are more or less coincident for the indices).
That, of course, leaves the quandary of whether to buy some really good looking names as the bounce up off this thus far 5-session pullback or just use it to let some downside plays set up on a bit of a recovery before they drop lower.
Read “The Daily” Entire Weekend Summary
Watch Market Overview Video
Watch Technical Summary Video
Here’s a trade from “The Daily” and insights into our trading strategy:
Chart by StockCharts.com
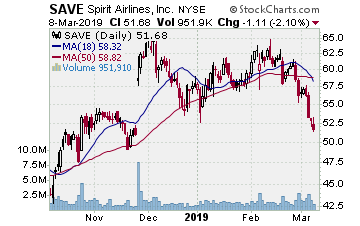
SAVE (Spirit Airlines, Inc.)
Company Profile
Saw the next downside move setting up as SAVE broke below the 50 day MA’s late February. Moved laterally into March to test the break, looked weak on 3/5. We put it on the report that night then on 3/6 SAVE broke lower and we stepped in with some March $55.00 strike put options for $4.00. The idea of the play was to play to the next support at the 200 day SMA. Thursday SAVE closed off the low, and Friday it started lower then tried to bounce some. We sold half the position for $5.40, a 35% gain. Letting the rest continue on toward the 200 day SMA.
SPY (SPDR S&P 500 ETF)
Company Profile
We entered SPY downside on 2/27 as the market looked to be topping and we wanted some downside exposure to the 50 day EMA as the first round of downside. We picked up some April $280.00 strike puts for $6.41. SPY did not drop immediately, but the index idled laterally, unable to move higher. Last week, of course, the market stumbled and on the Friday open SPY was near the 50 day EMA, the initial target. We sold half the position for $8.80, a35+% gain. If SPY shows more strength we take the rest, let it rebound, then try and reload.
Receive a 2 week trial and if you stay on receive a $30 per month discount!
2) STOCK SPLIT REPORT Here’s a leader play and our current analysis.
Chart by StockCharts.com
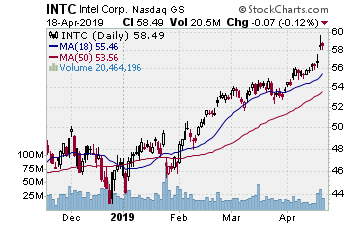
INTC (Intel–$52.48; -0.12; optionable)
Company Profile
EARNINGS: 04/25/2019
STATUS: Flag. INTC is testing its last move to a higher recovery high in its big base. Faded to the 20 day EMA as of the Friday open, gapping there then reversing upside to close near flat. A solid 9 month cup base and a good test of the gap higher from the second half of February. We want to play a continued move higher through our buy point for a rally back near the base high from early June 2018. That move gains 80% or so on the call options.
CHART VIDEO
Volume: 16.794M Avg Volume: 25.277M
BUY POINT: $52.78 Volume=26M Target=$56.55 Stop=$51.52
POSITION: INTC MAY 17 2019 52.50 C – (54 delta)
Learn more about our Stock Split Report and how we have made gains of 321% with our powerful stock split plays!
Save $360 per year on the Stock Split Report! Plus 2 week trial!
Chart by StockCharts.com
3) IH ALERTS
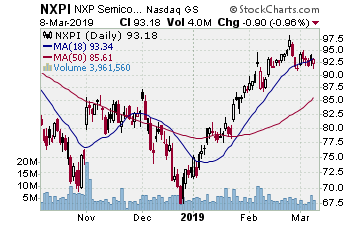
NXPI (NXP Semiconductors–$93.18; -0.89; optionable): Semiconductors
Company Profile
EARNINGS: 05/08/2019
STATUS: Double bottom with handle. This is certainly a pretty pattern with the double bottom spanning late October and that December low. From that second low, NXPI moved higher to the 200 day SMA in early February, broke through finally, but could not make headway. It spent the past 3 weeks working laterally at the 200 day. Very well set up to break higher, and this pattern was too savory not to put on the report. Thus, looking for a solid break higher that holds the move into the last hour of the session. That is our entry signal, and a move to the target gains 100%ish on the options, 11% on the stock.
CHART VIDEO
Volume: 3.962M Avg Volume: 4.689M
BUY POINT: $95.14 Volume=6.5M Target=$105.93 Stop=$91.54
POSITION: NXPI MAY 17 2019 95.00C – (51 delta) &/or Stock
Save $600 per year and enjoy a 2 week trial of our IH Alerts Service!
Chart by StockCharts.com
4) SUCCESS TRADING GROUP–by the MarketFN STG Team
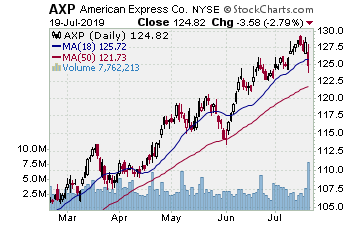
AXP (American Express Company) Company Profile
Our Success Trading Group members will be looking to enter new positions next week. We have many stocks on our radar including American Express Company (Ticker: AXP) and Eli Lilly and Company (Ticker: LLY).
Our Success Trading Group closed7 years with 0 losses on our Main Trade Table. In fact, we closed 100% winning trades for the calendar years 2016, 2015, 2013, 2012, 2011, 2010 and 2009 (we still have 1 open position from 2017 (all others were winners) and 1 trade that we opened in 2014 was closed as a losing trade). All of these trades are posted on our Main Trade Table for your review during your free membership trial period.
Get Our Next Trade Free – Save $50 per month! Details Here.
Chart by StockCharts.com
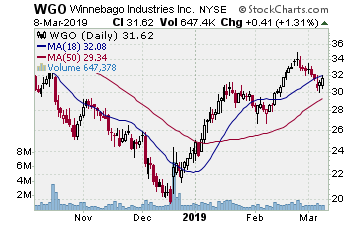
5) COVERED CALL PLAY
WGO – Winnebago Industries Inc. is currently trading at $31.62. The April $30.00 Calls (WGO20190420C00030000) are trading at $3.10. That provides a return of about 6% if WGO is above $30.00 on expiration Friday in April.
