Weekend Issue 7/7

THE WEEKEND ISSUE
Informing Investors Around The World
Read In All 50 States And Over 100 Countries
Weekend Newsletter for
July 7, 2019
Table Of Contents
1) MARKET SUMMARY from THE DAILY
2) STOCK SPLIT REPORT
3) IH ALERTS
4) SUCCESS TRADING GROUP
5) COVERED CALL SERVICE

1) MARKET SUMMARY
> > From Wednesday’s paid content of “The Daily” by Jon Johnson at InvestmentHouse.com. To get his latest information and his daily content, click here now to receive a two-week trial and save $30/month. (You won’t find this offer on the Investment House website. It is exclusively for The Weekender subscribers!)
Jobs report shakes up the market.
Stocks launch from a good setup and send both the DJ30 to a new all-time high and NASDAQ to a new closing high.
The economic data is so-so at best, but the market is relying on the Fed.
The interest rate on the 10-year government bond remains below 2% and the three month/10 year inversion continues to widen. Since the two-year yield has topped the five-year yield, it is clear that bonds are screaming louder at the Fed.
There have been some excellent breaks higher, and chips are now set to make strong moves.
We looked for some semiconductor positions on Friday as they were set up quite well, even when looking at the jobs report.
Market Summary (continued from above)
Were the fireworks early? Of course, since the S&P500 put in a new high even as the DJ30 chalked one up and NASDAQ put in an all-time closing high. The Tuesday session looked constructive, as noted in that dayâs report, and the setup yielded nice upside across the board.
Friday saw the release of the June Jobs Report, and that meant the arrival of ADP Wednesday. ADP missed again though it did top 100K. ADP pulled in 102K vs. 145K expected vs. 41K prior (from 27K)
In the “bad news is good news” world of a market that is relying on the Fed, that is good news. The other economic data was not great, though it was not terrible either.
DJ30: On Tuesday, I said it looked as if the S&P 500, DJ30 and NASDAQ indices were setting up nicely for a break higher. Indeed,that is what they did.
S&P 400 and the Russell 2000: The small- and mid-cap companies are not improving at the pace of the large-cap ones, but they are rising nicely. As I said on Tuesday, that’s the power of the Fed.
NASDAQ: As it reached the first closing high of the recovery, it is clear that the large-caps were taking the point in leading the upward climb.
SOX: While this was the lone negative close of the group, it had a very good setup. After gapping upside on Monday due to the trade truce and then fading during a good chunk of the move, SOX came back and filled the gap. On Wednesday, we had a nice doji at the March 2018 peak since the gap had been filled. That reality put SOX in a very good position to rebound.
NOTE: The figures and information above are from the 7/3 report due to the Fourth of July holiday.
NOTE #2: There are no new videos this week due to the Fourth of July holiday.
Here are two trades from “The Daily” and insights into our trading strategy:
Chart by StockCharts.com
DE (NYSE: Deere & Company)
Company Profile
DE already posted a strong run for us into late June and we banked some gains as it hit the target during the third week of June. As we let the other half of our shares work the market, that meant a test was coming. Except, not quite yet.
DE continued on an upside to $168 on 6/24. From there, it put in a nice one-two-three test to the 10-day exponential moving average (EMA). On Monday, DE gapped sharply higher due to the “trade truce” euphoria.
It gapped before starting to stall and fall. We went ahead and banked more gains by selling the call options that we had purchased at $7.00 for $23.60. In total, we obtained a cool 235% gain
AMRN (NASDAQ: Amarin Corporation plc)
Company Profile
Chart by StockCharts.com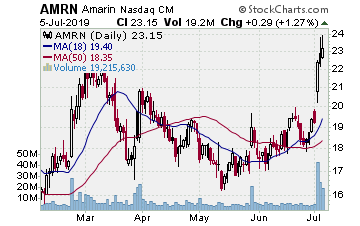
We picked up shares and options in AMRN when it broke higher on 6/16 and came off a test of the breakout from its 3+ month triangle base. We bought the stock for $18.62 and August $18.00 call options for $2.40. We love playing the resumption of a breakout after a test, particularly if the test takes the shape of a triangle, since the moves tend to be sharp.
While AMRN jumped higher for a few sessions, it soon became clear that it needed another test. Although AMRN fell back to the 50-day moving average (MA) at the end of June. That was a quick test, however, and AMRN jumped back up on last Thursday and Friday. Then,it gapped and surged on 7/2. On Wednesday, AMRN surged again and hit our target.
We sold some stock for $22.31 and banked 19%. We also sold half of our calls for $4.75 and banked over 95%. Now, we will see if AMRN can make us a really strong gain.
Receive a 2 week trial and if you stay on receive a $30 per month discount!
2) STOCK SPLIT REPORT
Here’s a leader play and our current analysis.
Chart by StockCharts.com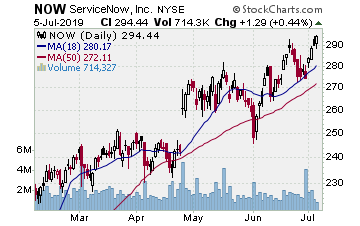
NYSE:NOW NOW (ServiceNow–$288.31; +4.80; optionable):Software
EARNINGS:07/24/2019
STATUS: NOW is working higher off of the lower trendline in its two-month uptrend channel. After it tested down to the lower support the past week, the stock started back upside this week with a solid volume. After some nice moves on the prior Friday, we are looking to play a continued move upside. We want to move in as NOW is likely to continue this bounce. A move to the target will gain around 70% on the options.
VOLUME: 1.936M Avg Volume: 1.667M
BUY POINT: $289.43 Volume=2M Target=$309.94 Stop=$282.77
POSITION: NOW AUG 16 2019 290.00C – (53 delta) &/or Stock
Learn more about our Stock Split Report and how we have made gains of 321% with our powerful stock split plays!
Save $360 per year on the Stock Split Report! Plus 2 week trial!
Chart by StockCharts.com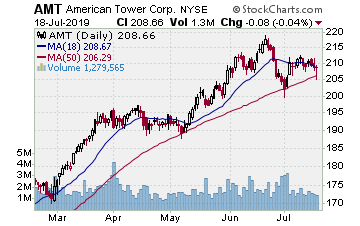
3) IH ALERTS
NYSE:AMT AMT (American Tower — $204.45; -1.40; optionable): Cell towers
Company Profile
EARNINGS: 07/31/2019
STATUS: AMT made us some solid money on its last run off the 50-day MA when it broke higher from that support in early May and rallied through mid-June. Over the past week and a bit more, AMT tested back to the 50-day MA. In general, a stock that is in a strong uptrend will rally up the 10- and 20-day exponential moving average (EMA) and make three to five bounces off those near term moving averages. Then, it will come back to test the 50-day MA. From there, the stock will reset the move if it remains strong. Since nothing suggests that AMT is losing strength, we want to see if AMT can deliver a new break higher. If it does and moves through our buy point on some volume, we will move in for an initial run back to the prior high. Of course, it could go higher than that. Thus, if the stock is working well, we will let some part of the play continue to work.
VOLUME: 2.965M Avg Volume: 1.795M
BUY POINT:$206.96 Volume= 2.8M Target=$218.74 Stop=$203.03
POSITION: AUG 16 2019 210.00C — (41 delta)
Save $600 per year and enjoy a 2 week trial of our IH Alerts Service!
Chart by StockCharts.com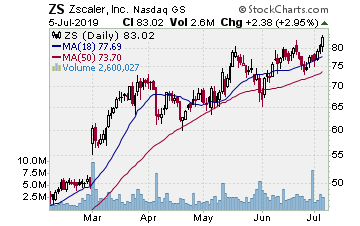
4) SUCCESS TRADING GROUP
— by the MarketFN STG Team
NASDAQ:ZS (Zscaler Inc.)
Company Profile
Our Success Trading Group members scored another winning trade this week when we closed out a position in Zscaler (NASDAQ:ZS). We are watching other several stocks and are looking forward to trading next week.
Our Success Trading Group closed seven years with zero losses on our Main Trade Table. In fact, we closed 100% winning trades for the calendar years 2016, 2015, 2013, 2012, 2011, 2010 and 2009. We still have one open position from 2017 (all others were winners) and one trade that we opened in 2014 but was closed as a losing trade.
All of these trades are posted on our Main Trade Table for your review during your free membership trial period.
Get Our Next Trade Free – Save $50 per month! Details Here.
Chart by StockCharts.com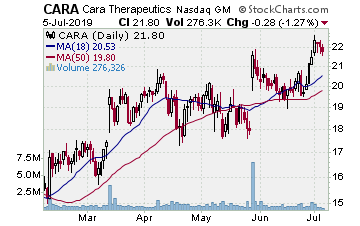
5) COVERED CALL PLAY
NASDAQ:CARA — Cara Therapeutics is currently trading at $22.08. The August $22.50 Calls (CARA20190817C00022500) are trading at $1.65. That provides a return of about 8% if CARA is above $22.50 by the time of the expiration.
Learn more about our Covered Call Tables
PREMIUM SERVICES
IH Alerts: InvestmentHouse.com’s Best of The Best Plays!
Stock Split Report: Forbes.com Best of the Web
Covered Calls: Allowed in your IRA – Energize your portfolio!
The Daily: “The Daily” is a must read for all investors!
Success Trading Group: 7 years without a trading loss!
The foregoing is commentary for informational purposes only. All statements and expressions are the opinions of Online Investment Services, LP., or Split Ventures, Ltd. This information is not meant to be a solicitation or recommendation to buy, sell, or hold securities. We are not licensed or registered in the securities industry. The information presented herein and on the related web site has been obtained from sources believed to be reliable, but its accuracy is not guaranteed. The security portfolios of writers for this issue may, in some instances, include securities mentioned herein and on the related web site. Estimates, assumptions and other forward-looking information are subject to the limits of forecasting. Actual future developments may differ materially due to many factors. No one associated herewith receives compensation in any manner from any of the companies that are discussed in this newsletter or on the related websites.
